


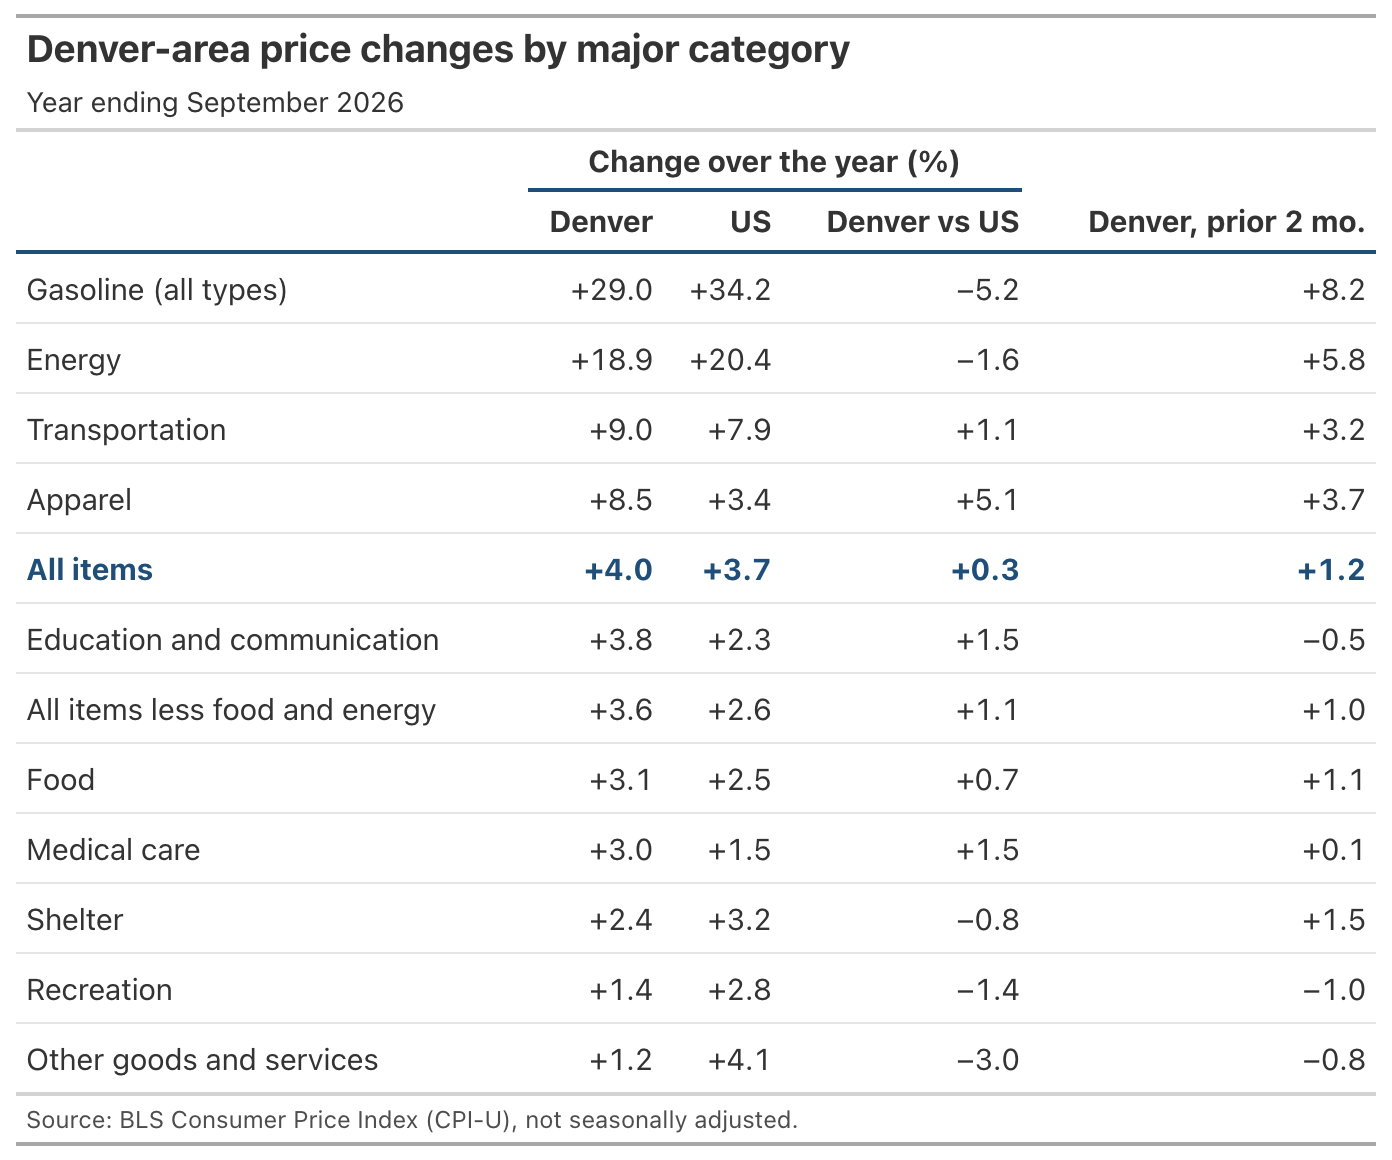
Today the Bureau of Labor Statistics released September 2026 Consumer Price Index data for the Denver-Aurora-Lakewood metro area. Prices in the Denver area rose 4.0 percent over the year ending in September 2026. Nationally, prices rose 3.7 percent over the same period. Core inflation, which strips out food and energy, ran 3.6 percent in the Denver area against 2.6 percent for the US. The Denver headline number is up from 3.9 percent in the July release.
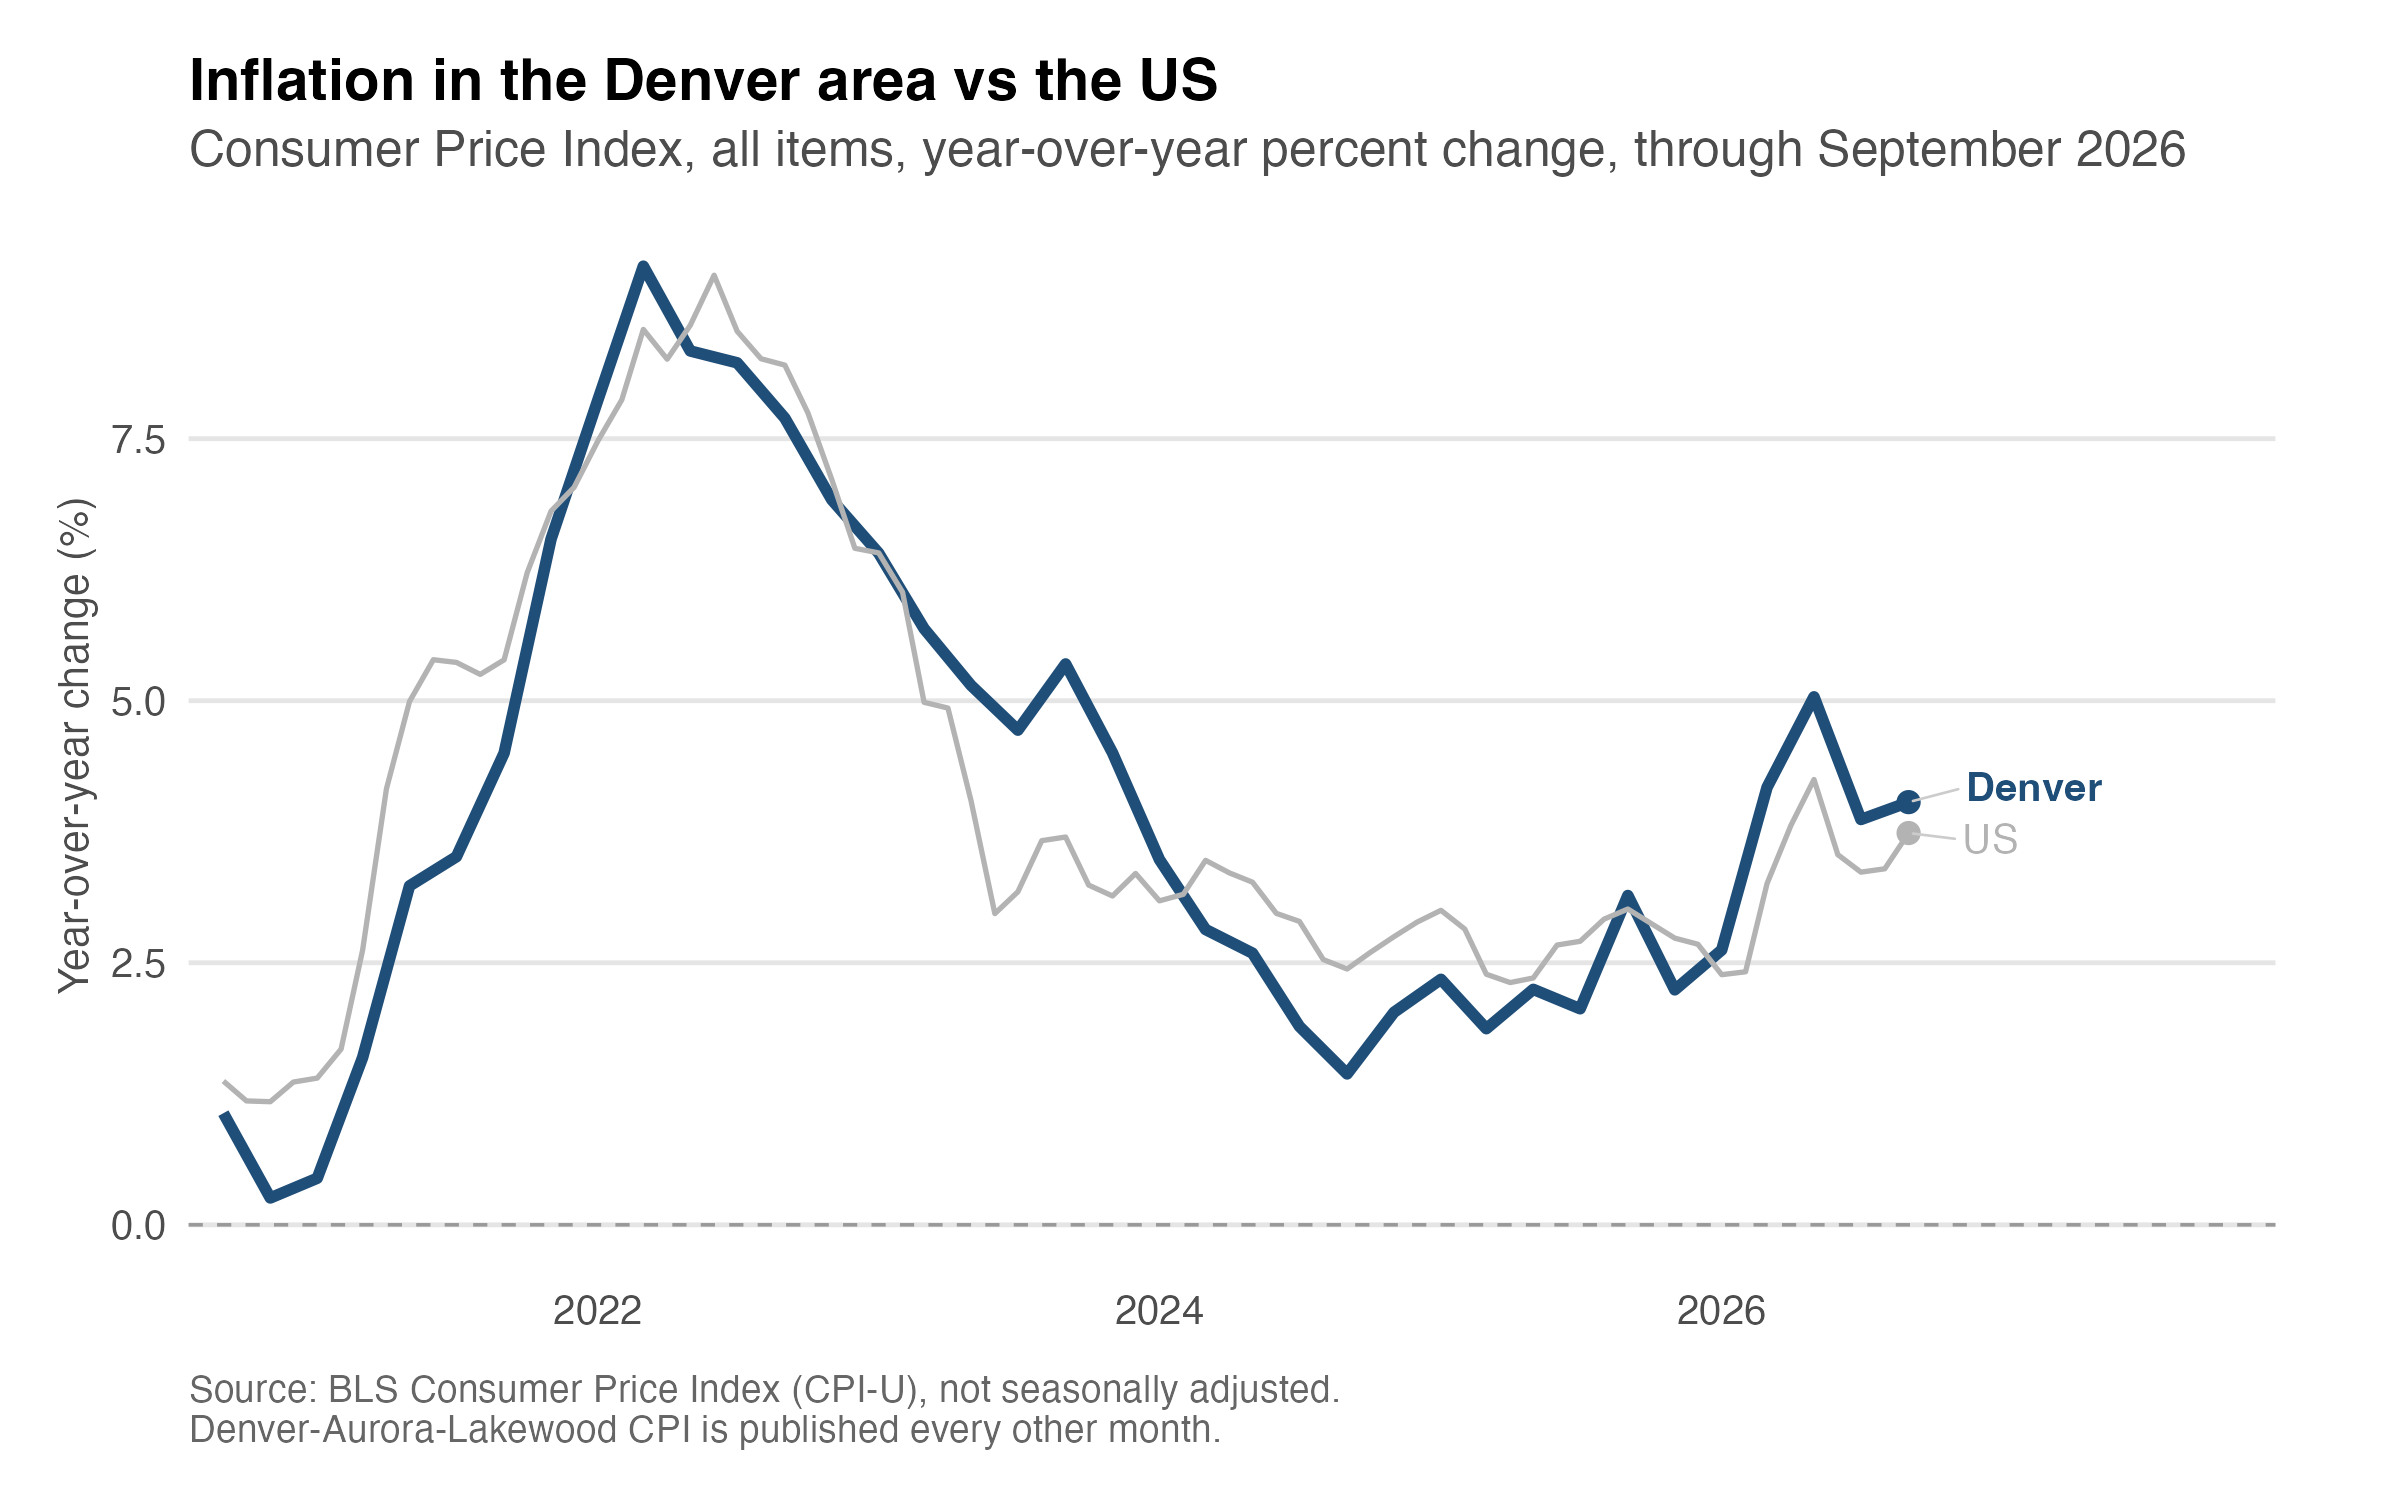
Denver area inflation is just above the previous release and continues to move close to the national average on the full index. However, core inflation in the Denver area is a full percentage point above the US average.
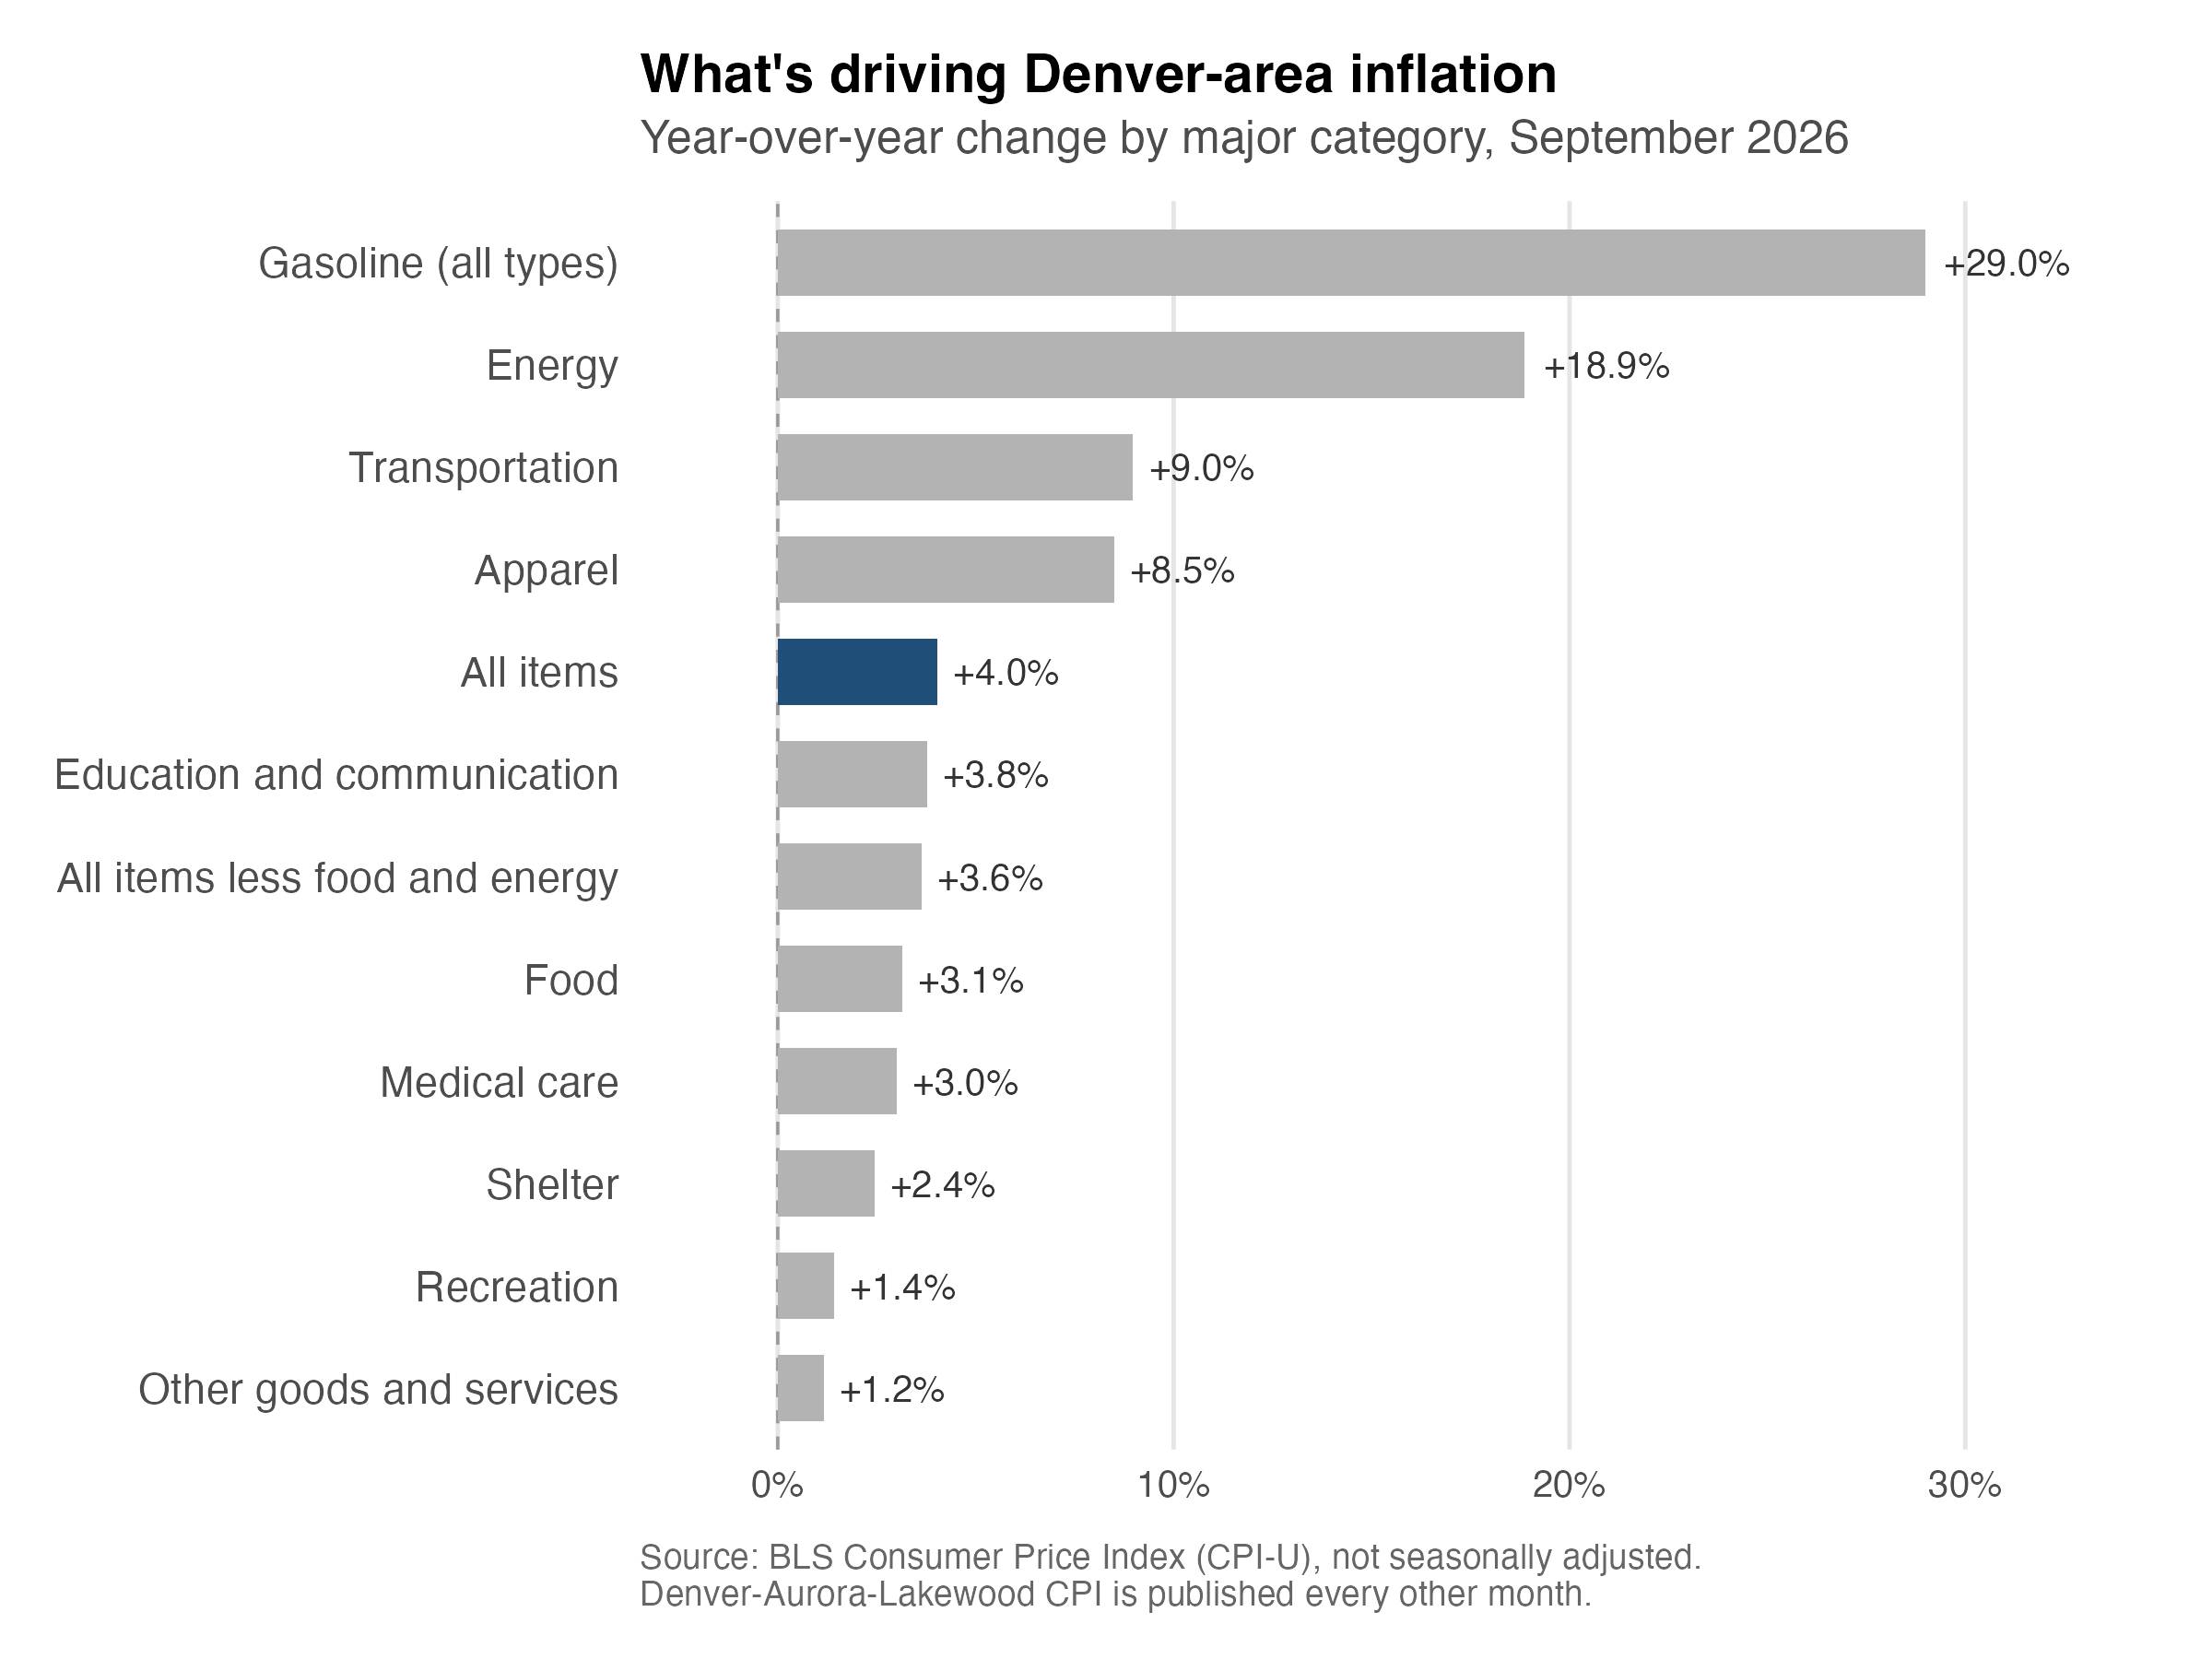
As detailed below and likely no surprise to most people, gas prices are still a major contributor to the current inflation numbers. In my post on the previous release, I noted the slight slowdown in gas price increases with the hope that this would continue. Unfortunately, I was too optimistic.
Although there was a 1.5% increase in shelter prices in the two months since the July report, we are still below shelter inflation relative to the U.S. average.
Where prices moved
By major category, the fastest-rising component over the past year was Energy at 18.9 percent, with gasoline up 29.0 percent, and the slowest was Other goods and services at 1.2 percent. Shelter rose 2.4 percent, and food rose 3.1 percent.
Notable moves
The Denver CPI covers 55 published item categories beyond the headline number. A few stand out this release.
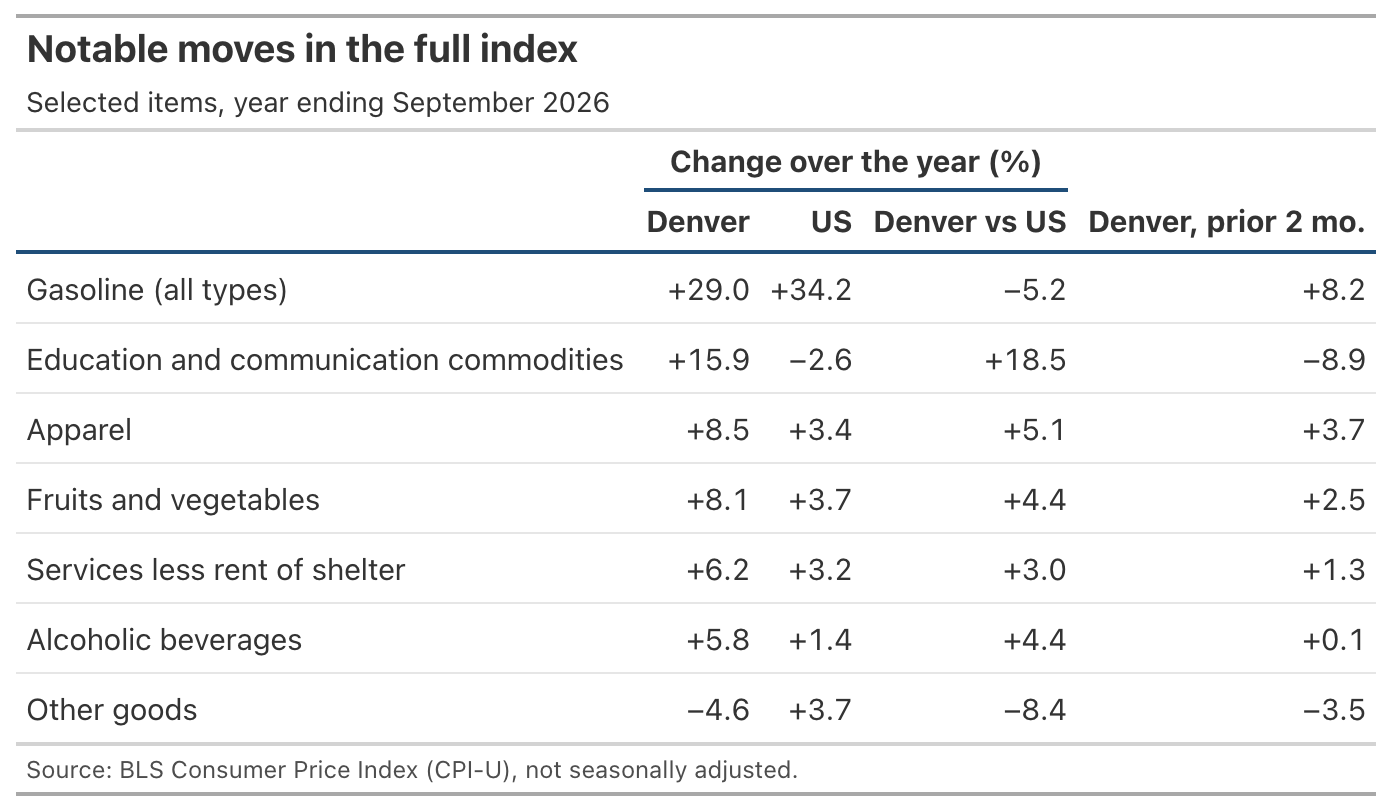
Gas is at the top of the list of notable moves and I won’t spend much time on it other than noting that gas prices are up more than 8% in the two months since the July report.
Services less rent of shelter are up over 6% on the year and this is also 3 points higher than the U.S. average. This specific category includes things like insurance, medical care, childcare, phone, and internet services among others. Without additional details it’s difficult to say which specific services are contributing most to the rise but this is sure to hit many people’s budgets.
Similarly a few goods categories including apparel, fruits and vegetables, and alcohol are all up and well above the U.S. average. Time to eat more meat and drink less I guess.
Other goods are down 4.6% compared to 3.7% for the U.S. average. This category includes goods like tobacco, personal care, and other miscellaneous items. Although this appears as the one highlight of the report in terms of price relief, it very well could reverse in the next two months when the next report comes out. I wouldn’t bank on sustained price decreases in this area.