


A quick note on this post: This is the first of a regular series on Front Range Economics summarizing the bi-monthly BLS CPI release for the Denver-Aurora-Lakewood metro area. The basic structure for each post in this series will remain the same and I will offer some light commentary on the release. The creation of this post relies on a template and the use of an AI agent to run the data pull and create the charts and tables you see below. I also have template language for the basic information of the data release, and then write commentary specific to each release. I am experimenting a bit here so any feedback is welcome.
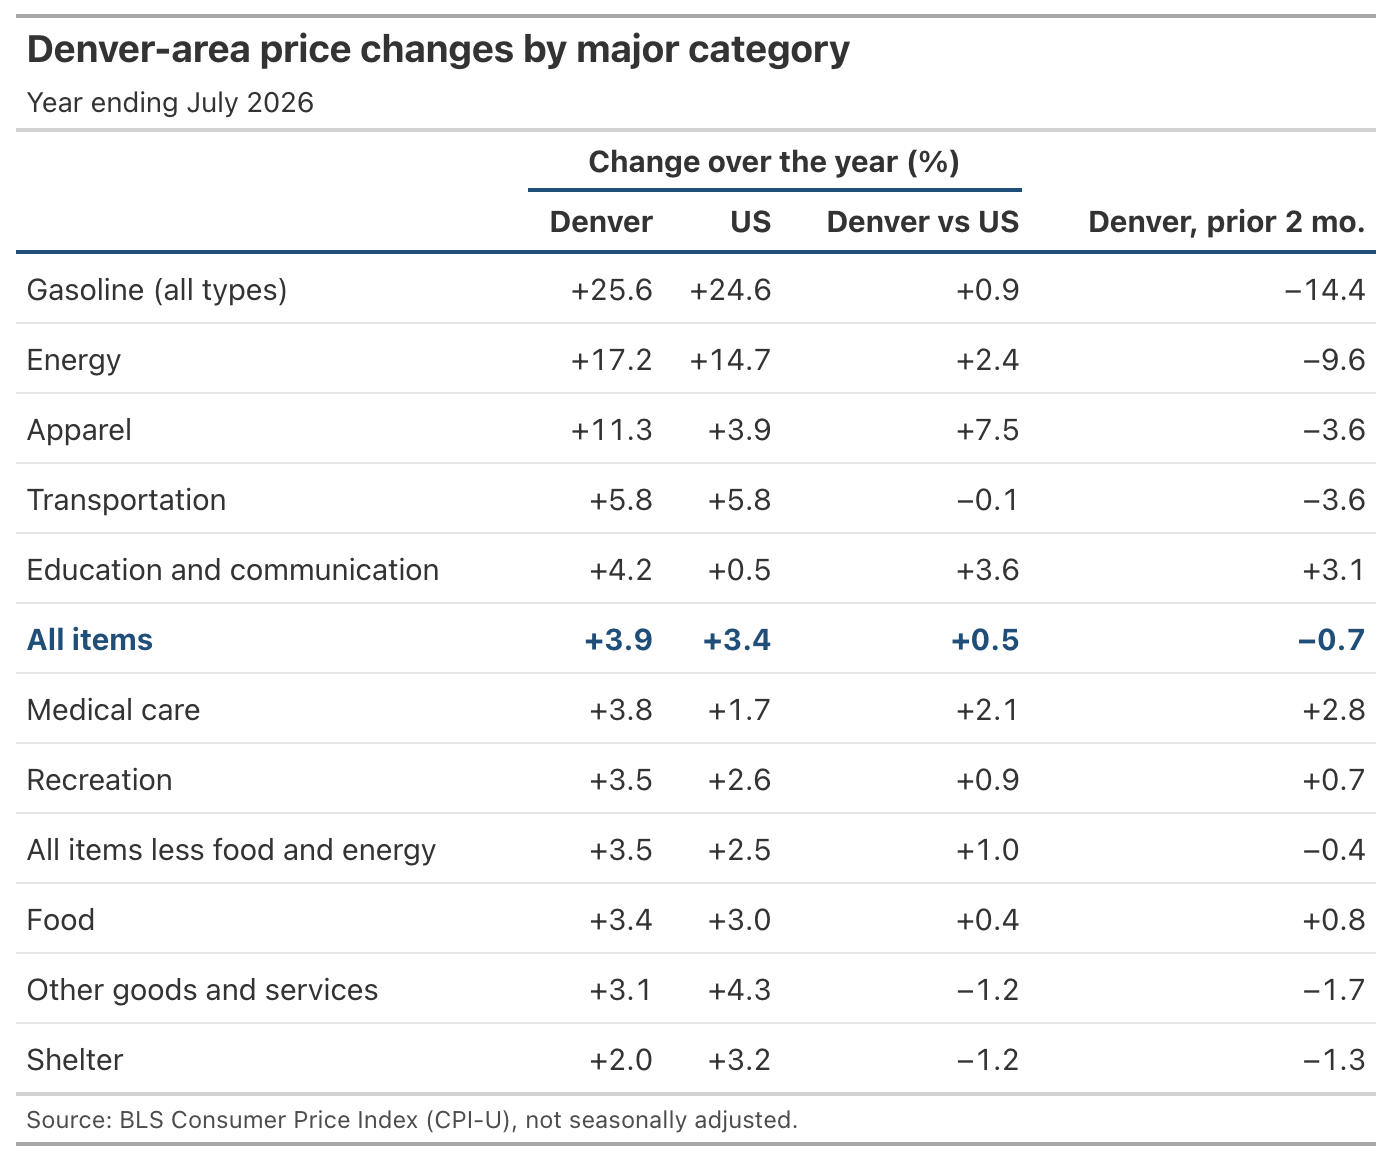
Today the Bureau of Labor Statistics released the July 2026 Consumer Price Index data for the Denver-Aurora-Lakewood metro area. Prices in the Denver area rose 3.9 percent over the year ending in July 2026. Nationally, prices rose 3.4 percent over the same period. Core inflation, which strips out food and energy, ran 3.5 percent in the Denver area against 2.5 percent for the US. The Denver headline number is down from 5.0 percent in the May release.
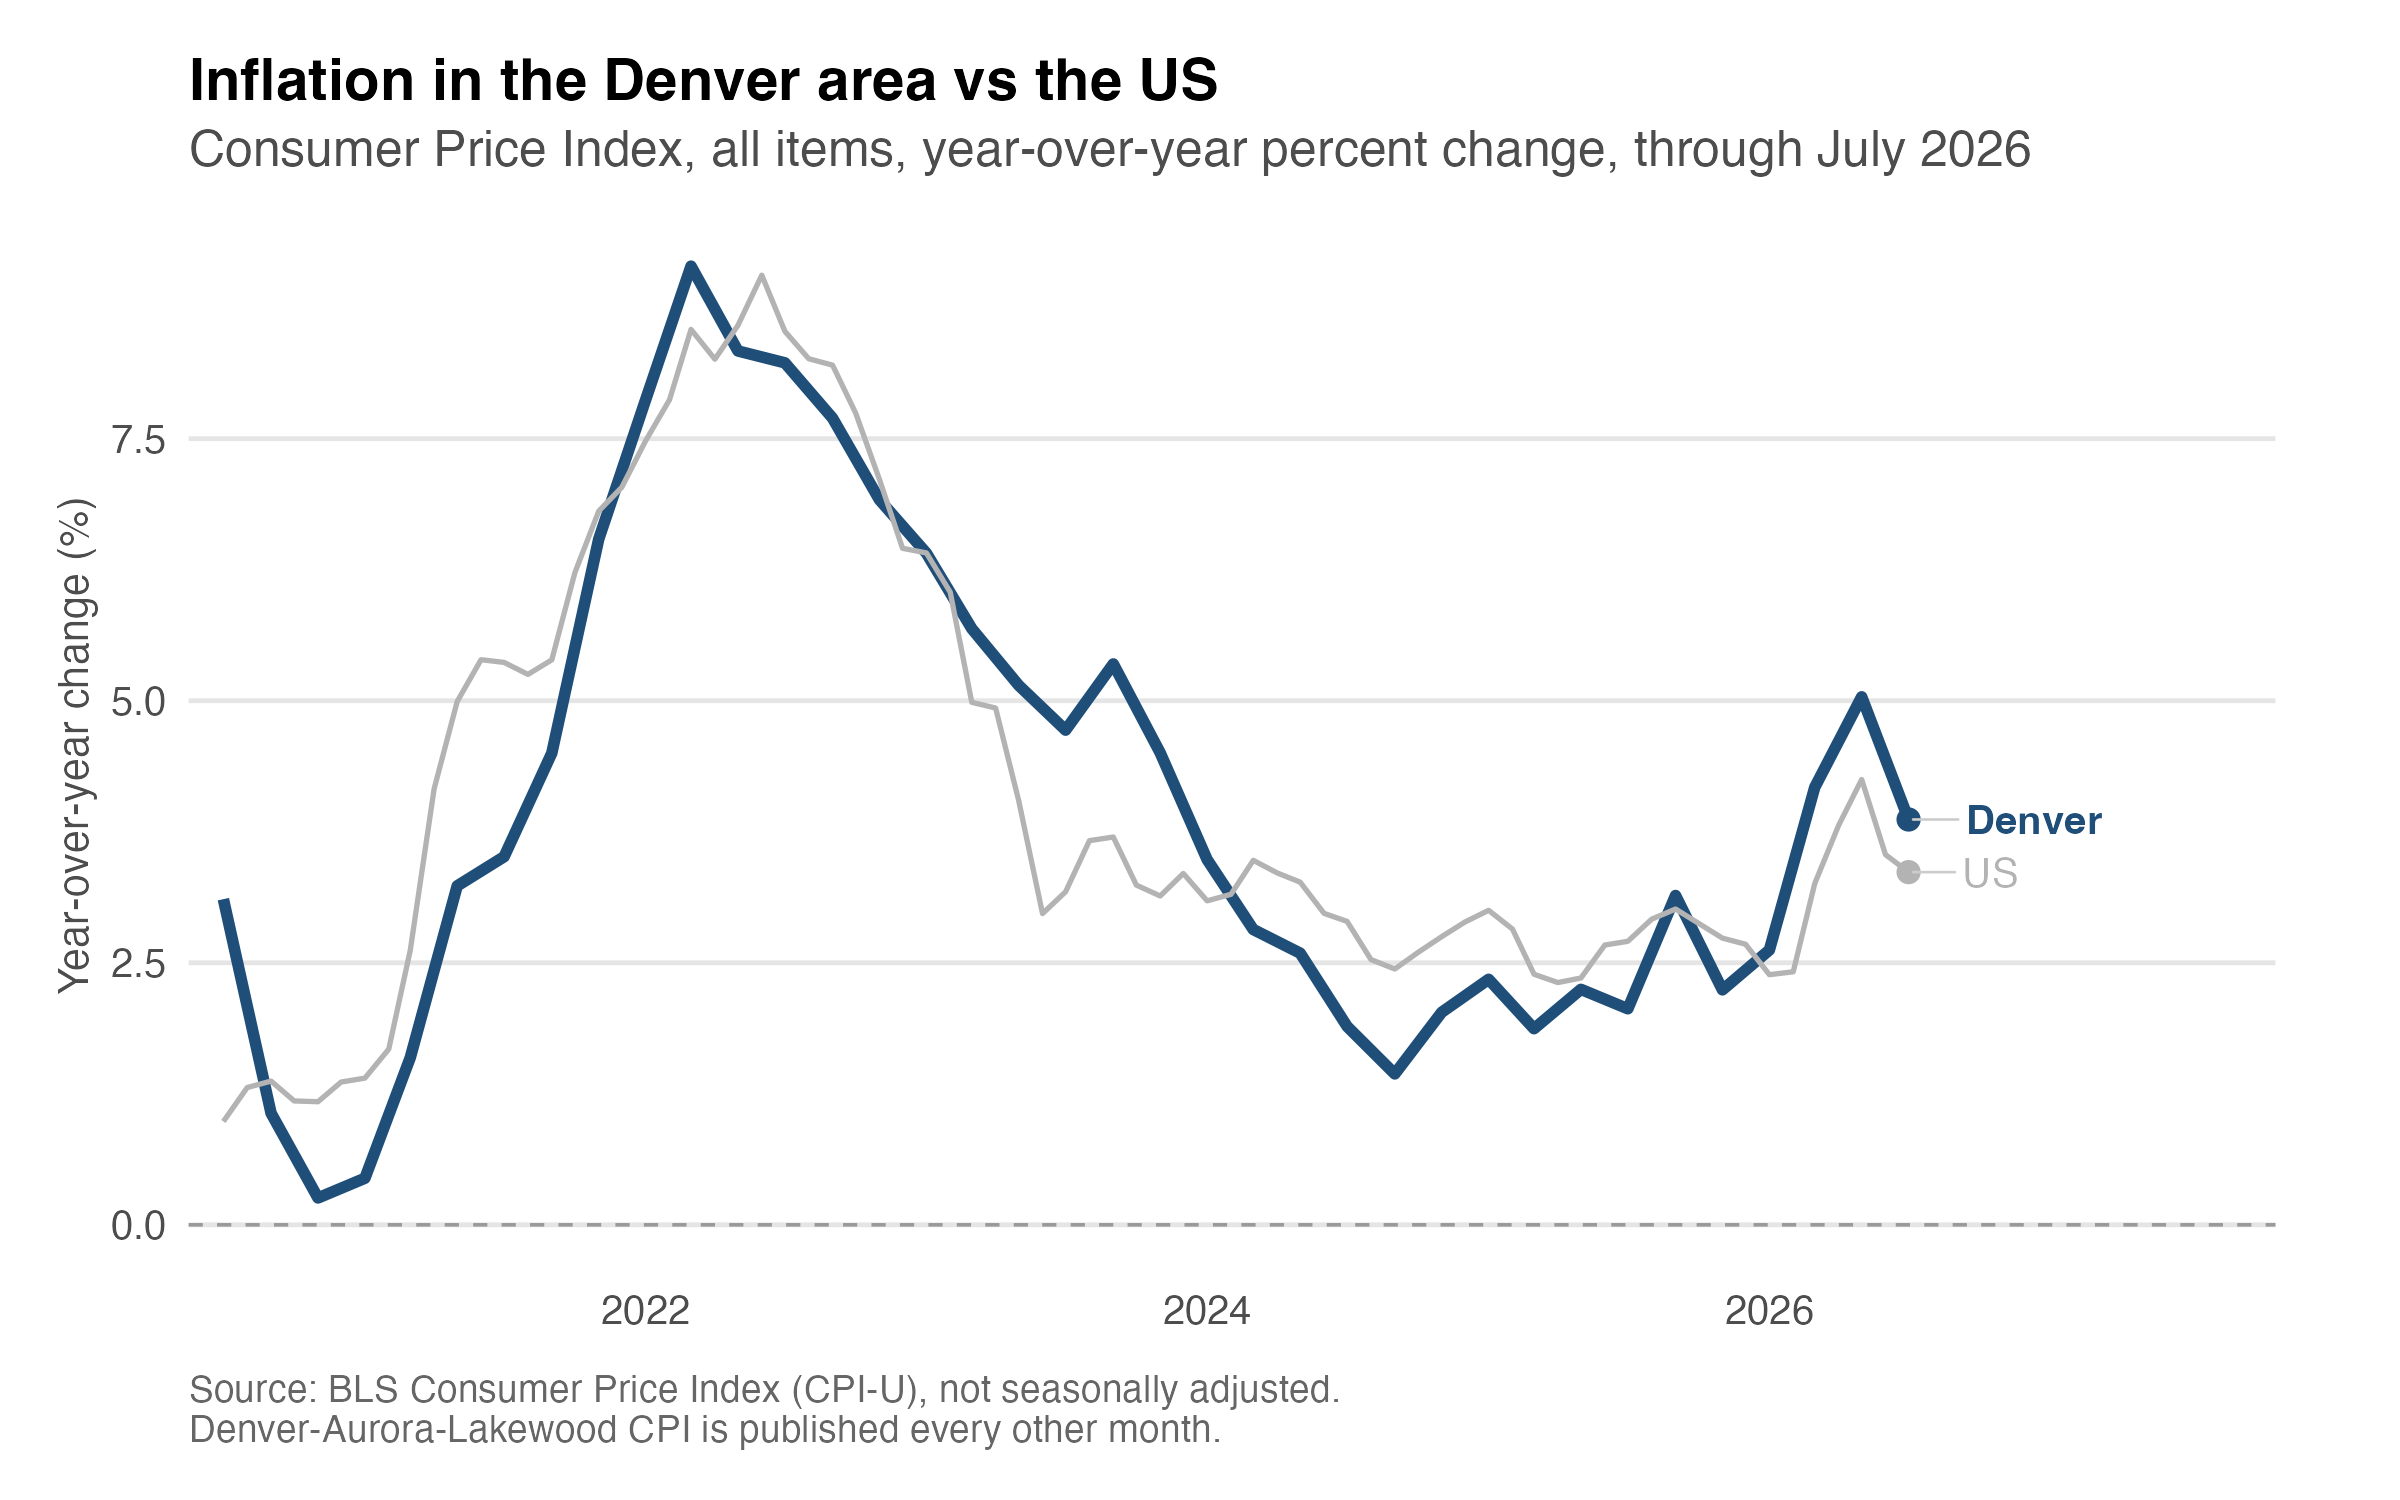
Denver area inflation is still slightly above the U.S. average but a bit closer than it was two months ago. As I will get more into below, a big part of increasing prices around Denver are rising gas prices. It’s difficult to say how long this will last, given the uncertainty of the war in Iran, but the recent slow down may be a sign for optimism. After a steady decline in inflation from its peak in 2022, Denver area inflation was creeping back up above 2.5% at the start of 2026. Hopefully, May 2026 was another peak and we are on the way back down toward lower inflation. We will have to wait until October to see if this continues.
Where prices moved
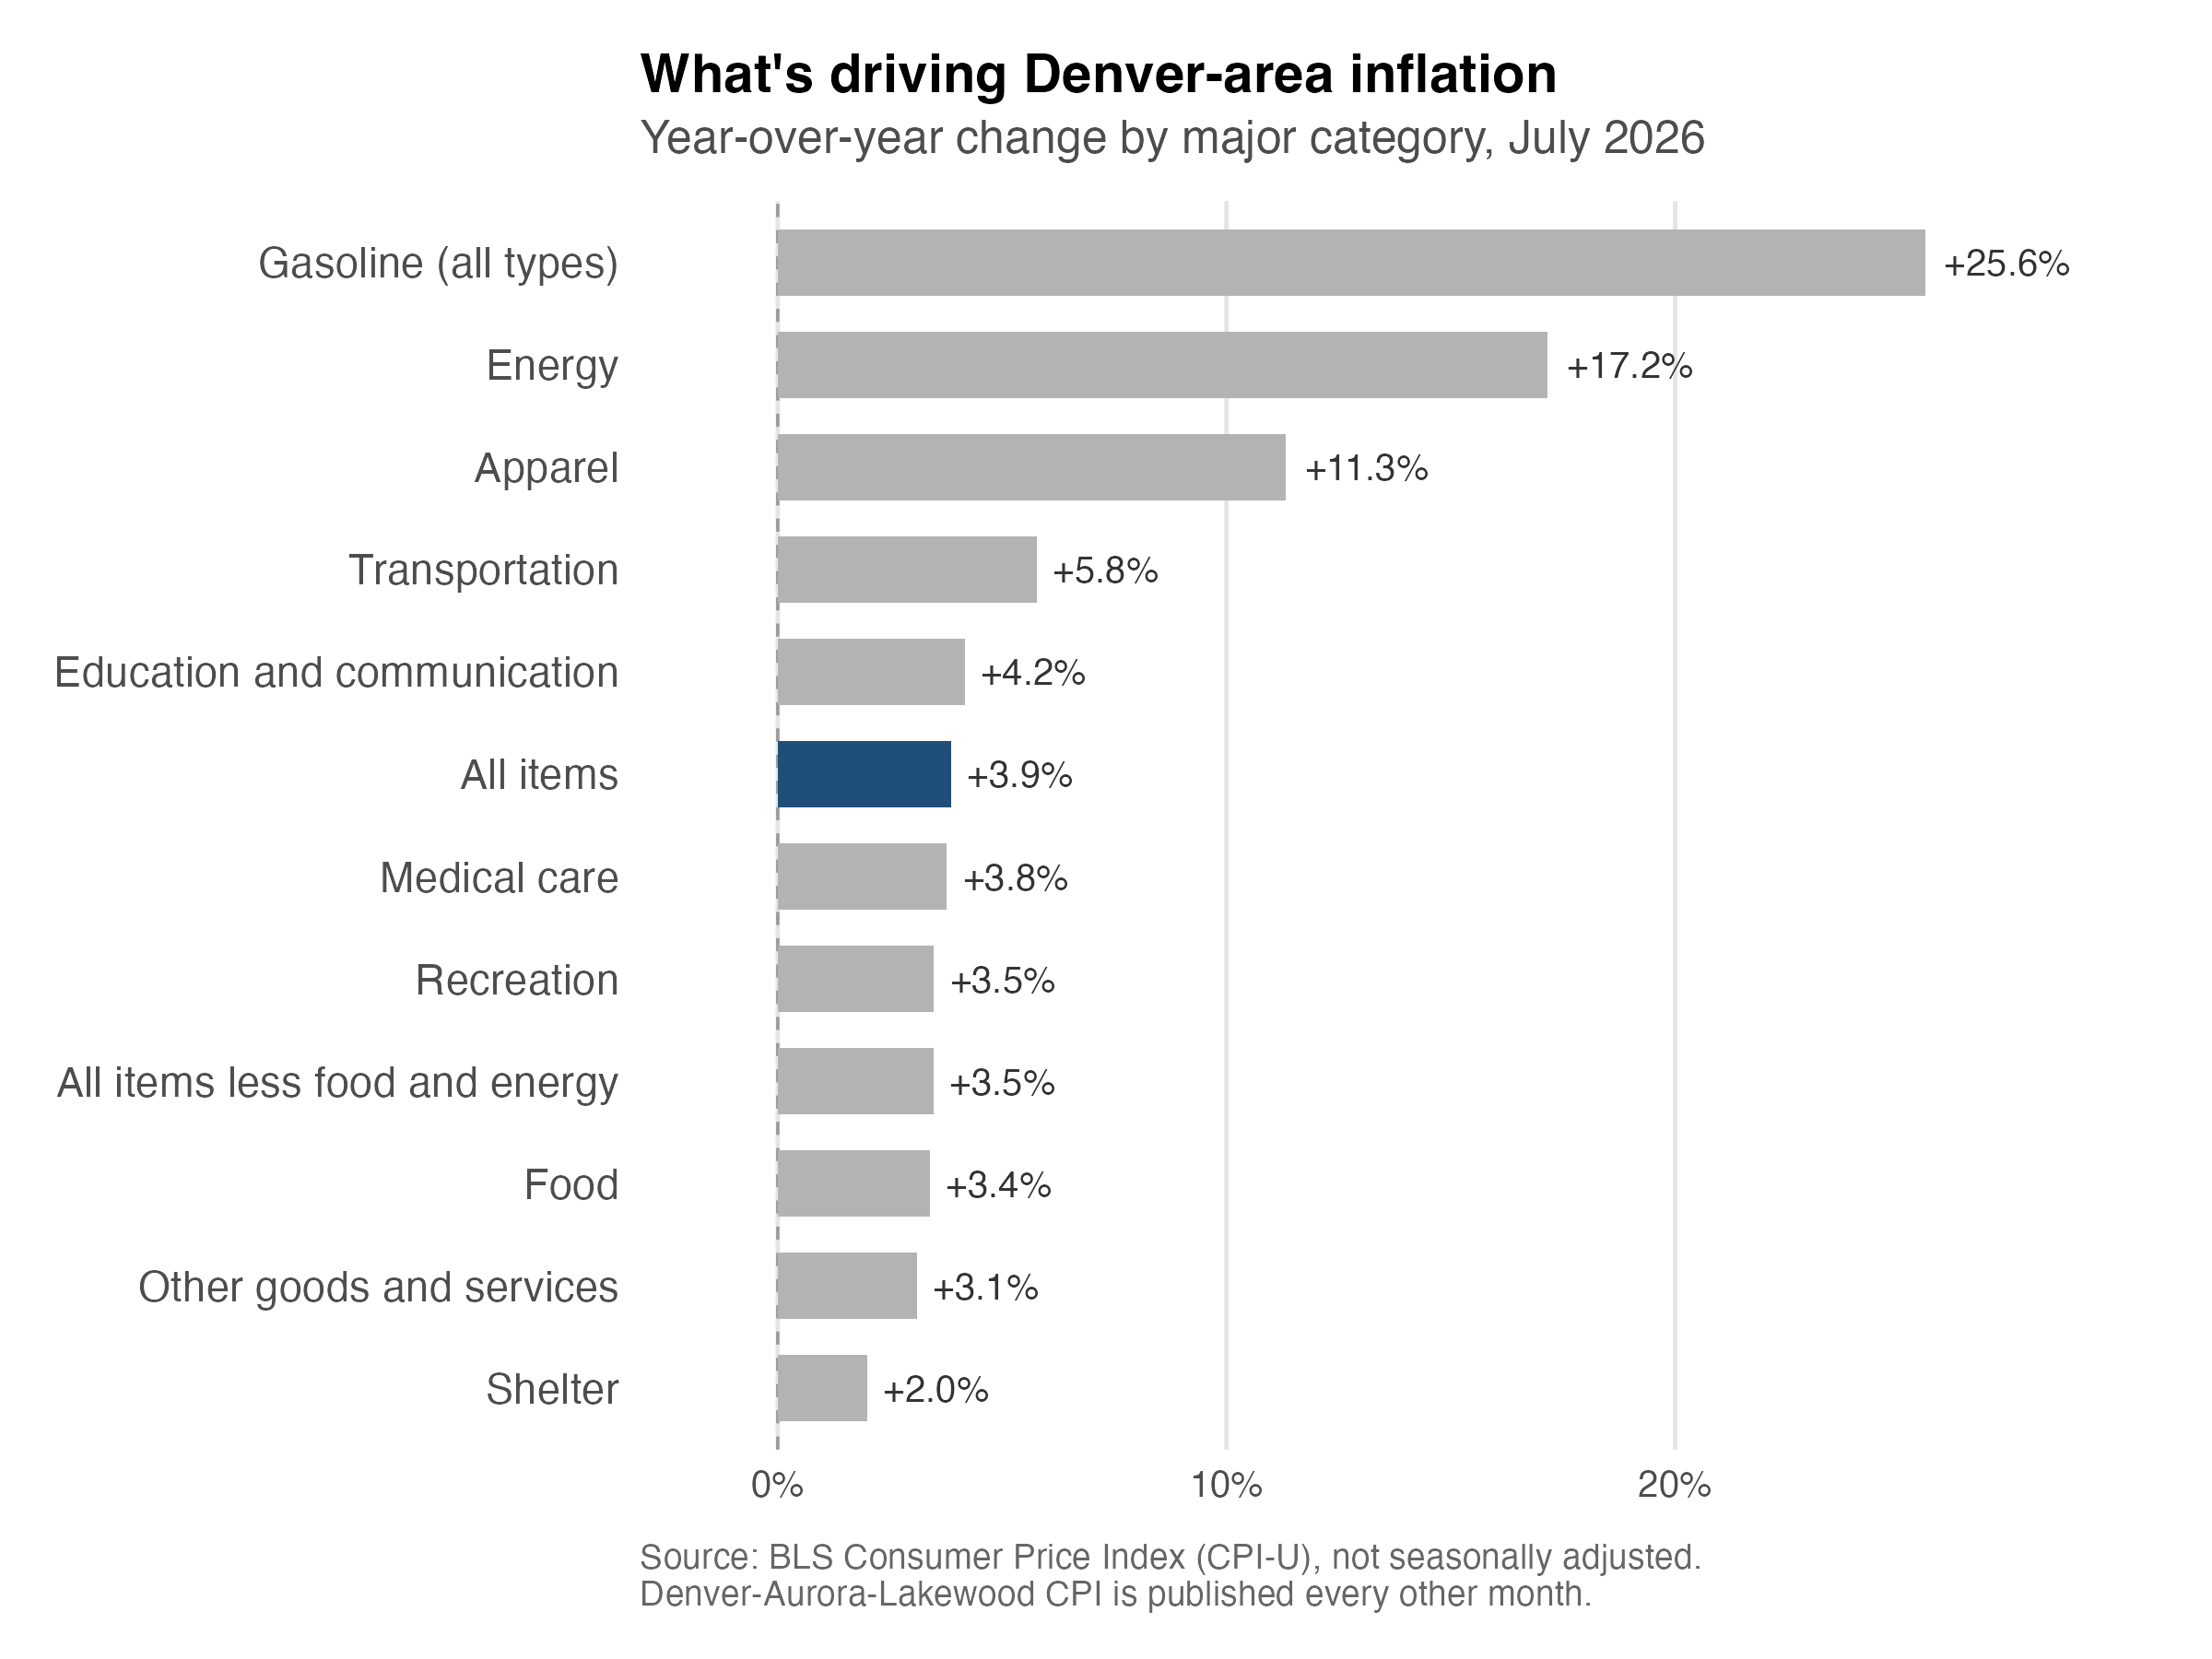
By major category, the fastest-rising component over the past year was Energy at 17.2 percent, with gasoline up 25.6 percent, and the slowest was Shelter at 2.0 percent. Food rose 3.4 percent.
Notable moves
The Denver CPI covers 55 published item categories beyond the headline number. A few stand out this release as shown in the table below.
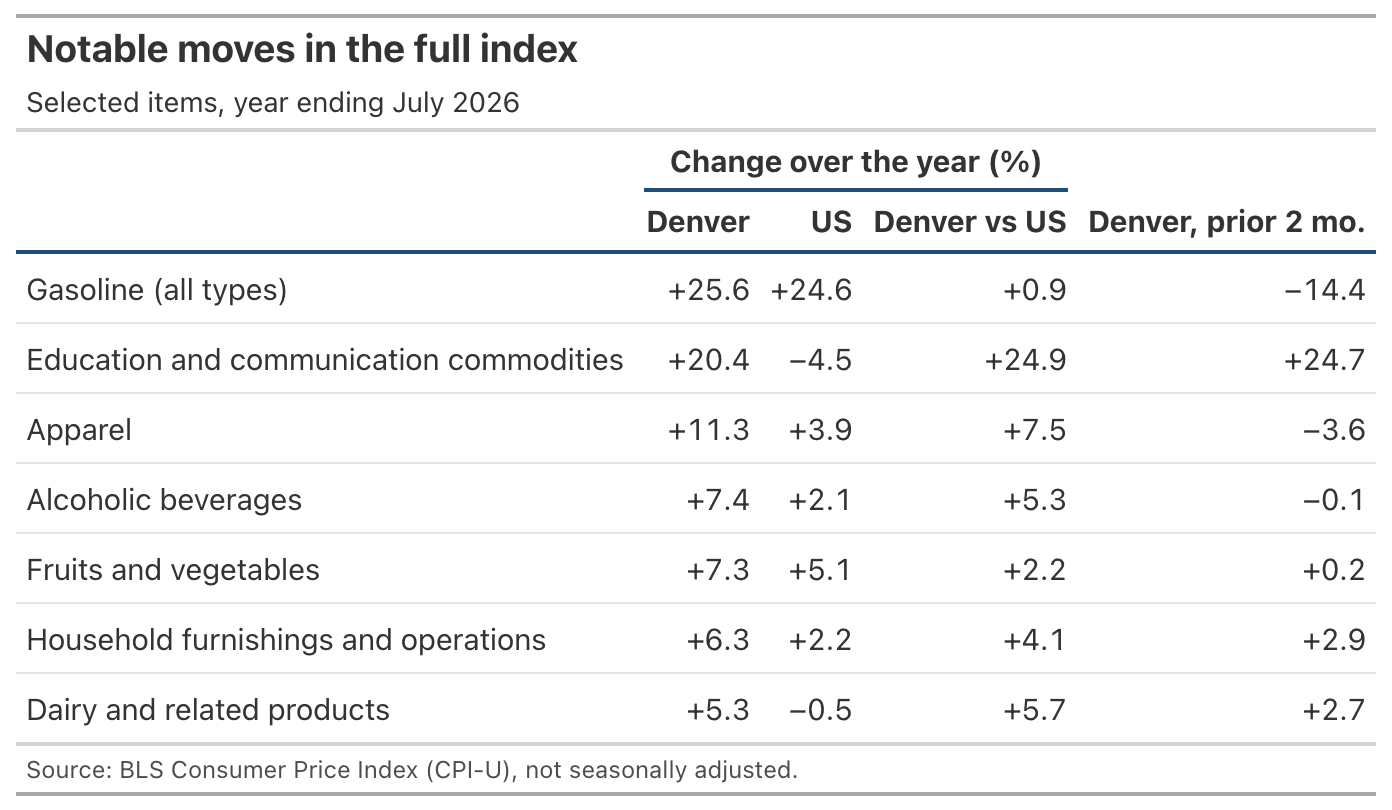
Gas prices are still up on the year, but have declined over the last two months. This should be a notable relief for many people after the shock of going from under $2.50/gallon earlier this year to over $4.00/gallon in just a few months. When I have filled up recently I am now paying closer to $3.50/gallon depending on where I go.
The year-over-year increase for the education and communication commodities category is a bit odd. Not only is it the second highest year-over-year increase in the table, but is substantially higher than the change nationally. Given the data I have, I cannot tell exactly what is contributing to this but it may be related to computer and software price increases. I wouldn’t put much into that ‘maybe’ though, could simply be noisy data as the BLS warns for small samples in these local item areas.
The shelter category (which includes rents, implied rents of owner-occupied homes, and things like hotel stays) shows prices are up on the year but lower when compared nationally and showed a decline compared to the May release. This is a trend I think many in the area would like to see continue, especially renters who have seen some relief in rent over the last year or so. But you may feel differently if you are trying to sell a condo right now.