


Part 1 of this post on Denver’s restaurant industry looked at restaurant employment and establishments. I compared changes in both metrics relative to their 2019 levels using surrounding counties and a small group of “peer counties” to reach the following conclusions: 1) Denver full-service restaurants are in a clear slump, and 2) Denver limited-service restaurants are doing OK; employment and establishments are still above pre-pandemic levels. The first part of this conclusion confirms what much local reporting and other posts on this subject have found, but I have not seen much of anything discussing the limited-service side of the problem. If you haven’t read that post already, check it out before getting into Part 2 here.
The conclusions from Part 1 are surprising for a couple reasons. First is that Denver appears to be facing a distinct problem among its full-service restaurants, suggesting that there are factors specific to Denver causing this. I wouldn’t go as far as to say this is unique to Denver. But across similar counties and other counties in the metro area, Denver stands out. Second is that the problem is mostly limited to full-service. In terms of both employment and establishments, limited-service restaurants are not struggling in the same way.
On the question of why this is happening, I want to be able to explain what it is about Denver but also differences across restaurant type to have a better understanding of why Denver’s full-service restaurants specifically are struggling so much. When I first started doing the background research and drafting for this follow-up post, I was going to cover a few different factors including labor costs, regulatory issues, and a bit on the demand side.
But as I continued working on this, the labor costs side of the story seemed to be the most compelling and will be the focus of what follows. Labor costs are among the chief concerns raised by operators as detailed in the State of Denver Restaurants report linked in the previous post. This complaint made sense to me as a real problem but some critics of the report have viewed this more as owners vs. workers and framed labor costs as a scapegoat for other issues. Some critics of the report have even gone so far as to argue that there are simple conflict-of-interest reasons why the report focused on labor costs and the minimum wage. I believe the critics were too quick to dismiss labor costs as a major part of the story.
I will make the case that Denver’s minimum wage increases since 2020, particularly for the tipped minimum wage, can explain some of the full-service restaurant struggles. Then, I will propose a hypothesis related to this that can explain why limited-service restaurants in Denver are faring better. On the question of what can be done, I have more uncertainty. Given the evidence I show in this post, lowering Denver’s tipped minimum wage to the state level seems reasonable. What I am uncertain about is how much of an effect it would really have and how likely it is to happen as it seems like an unpopular idea.
I realize that this post is only looking at one among multiple causes of the decline in Denver’s restaurants and it would be silly to claim that there is a single cause that completely explains the decline. Too many things are happening at once that are impacting operating costs and the demand side for restaurants to really nail down what is happening in a single city. That doesn’t mean the minimum wage isn’t an important part of this story. For the reader who wants to look at evidence of other factors contributing to the general problem with Denver’s restaurants, I will link again to the State of Denver Restaurants report. That report isn’t the only source out there on this issue and was conducted on behalf of restaurant operators but does cover many different factors.
Real Wages in Full-Service Restaurants: Denver vs. Comparison Counties
Before getting into the minimum wage, I want to show a couple of comparisons along the lines of what I did for Part 1 but now looking at real wages for full-service restaurant employees. I will be using QCEW data again to make these comparisons and the same two groups of comparison counties (neighboring counties and the peer counties group). From the QCEW data, I have nominal weekly wages for full-service restaurant employees in each county through Q3 2025. Then following the BEA’s method for implicit regional price deflators, wages are deflated using the product of the relevant Regional Price Parity (RPP) and the national PCE price index.1 I will use the same indexing strategy as before where the wages for each county are set to 100 in Q1 2019. Then, I can compare how wages have evolved since 2019 across these counties to see whether restaurant workers in Denver have experienced wage growth that stands out from comparison counties. I am also separating this from the minimum wage discussion that follows because wage gains that appear in this series are not representative of wage gains directly related to increases in the minimum wage. The minimum wage will have an effect but not for every restaurant employee captured in this data.
Because we are looking at total weekly wages divided by employee head count, the average weekly wage series for each county is capturing full-time employees, part-time employees, salaried employees, tipped employees, non-tipped employees, you get the idea. The point is, using this data alone, I don’t know what the composition of employees looks like and cannot make clear claims about how much of any wage increase is due to the minimum wage specifically. So even if wages are rising during the period of minimum wage increases in Denver, some of that might be due to the minimum wage increase, but some of it could also reflect a data artifact such as a shift toward full-time workers pushing up weekly wages or other factors unrelated to the minimum wage. But I still want to know how wages have evolved in Denver compared to other places to understand how distinct the labor costs problem actually is.
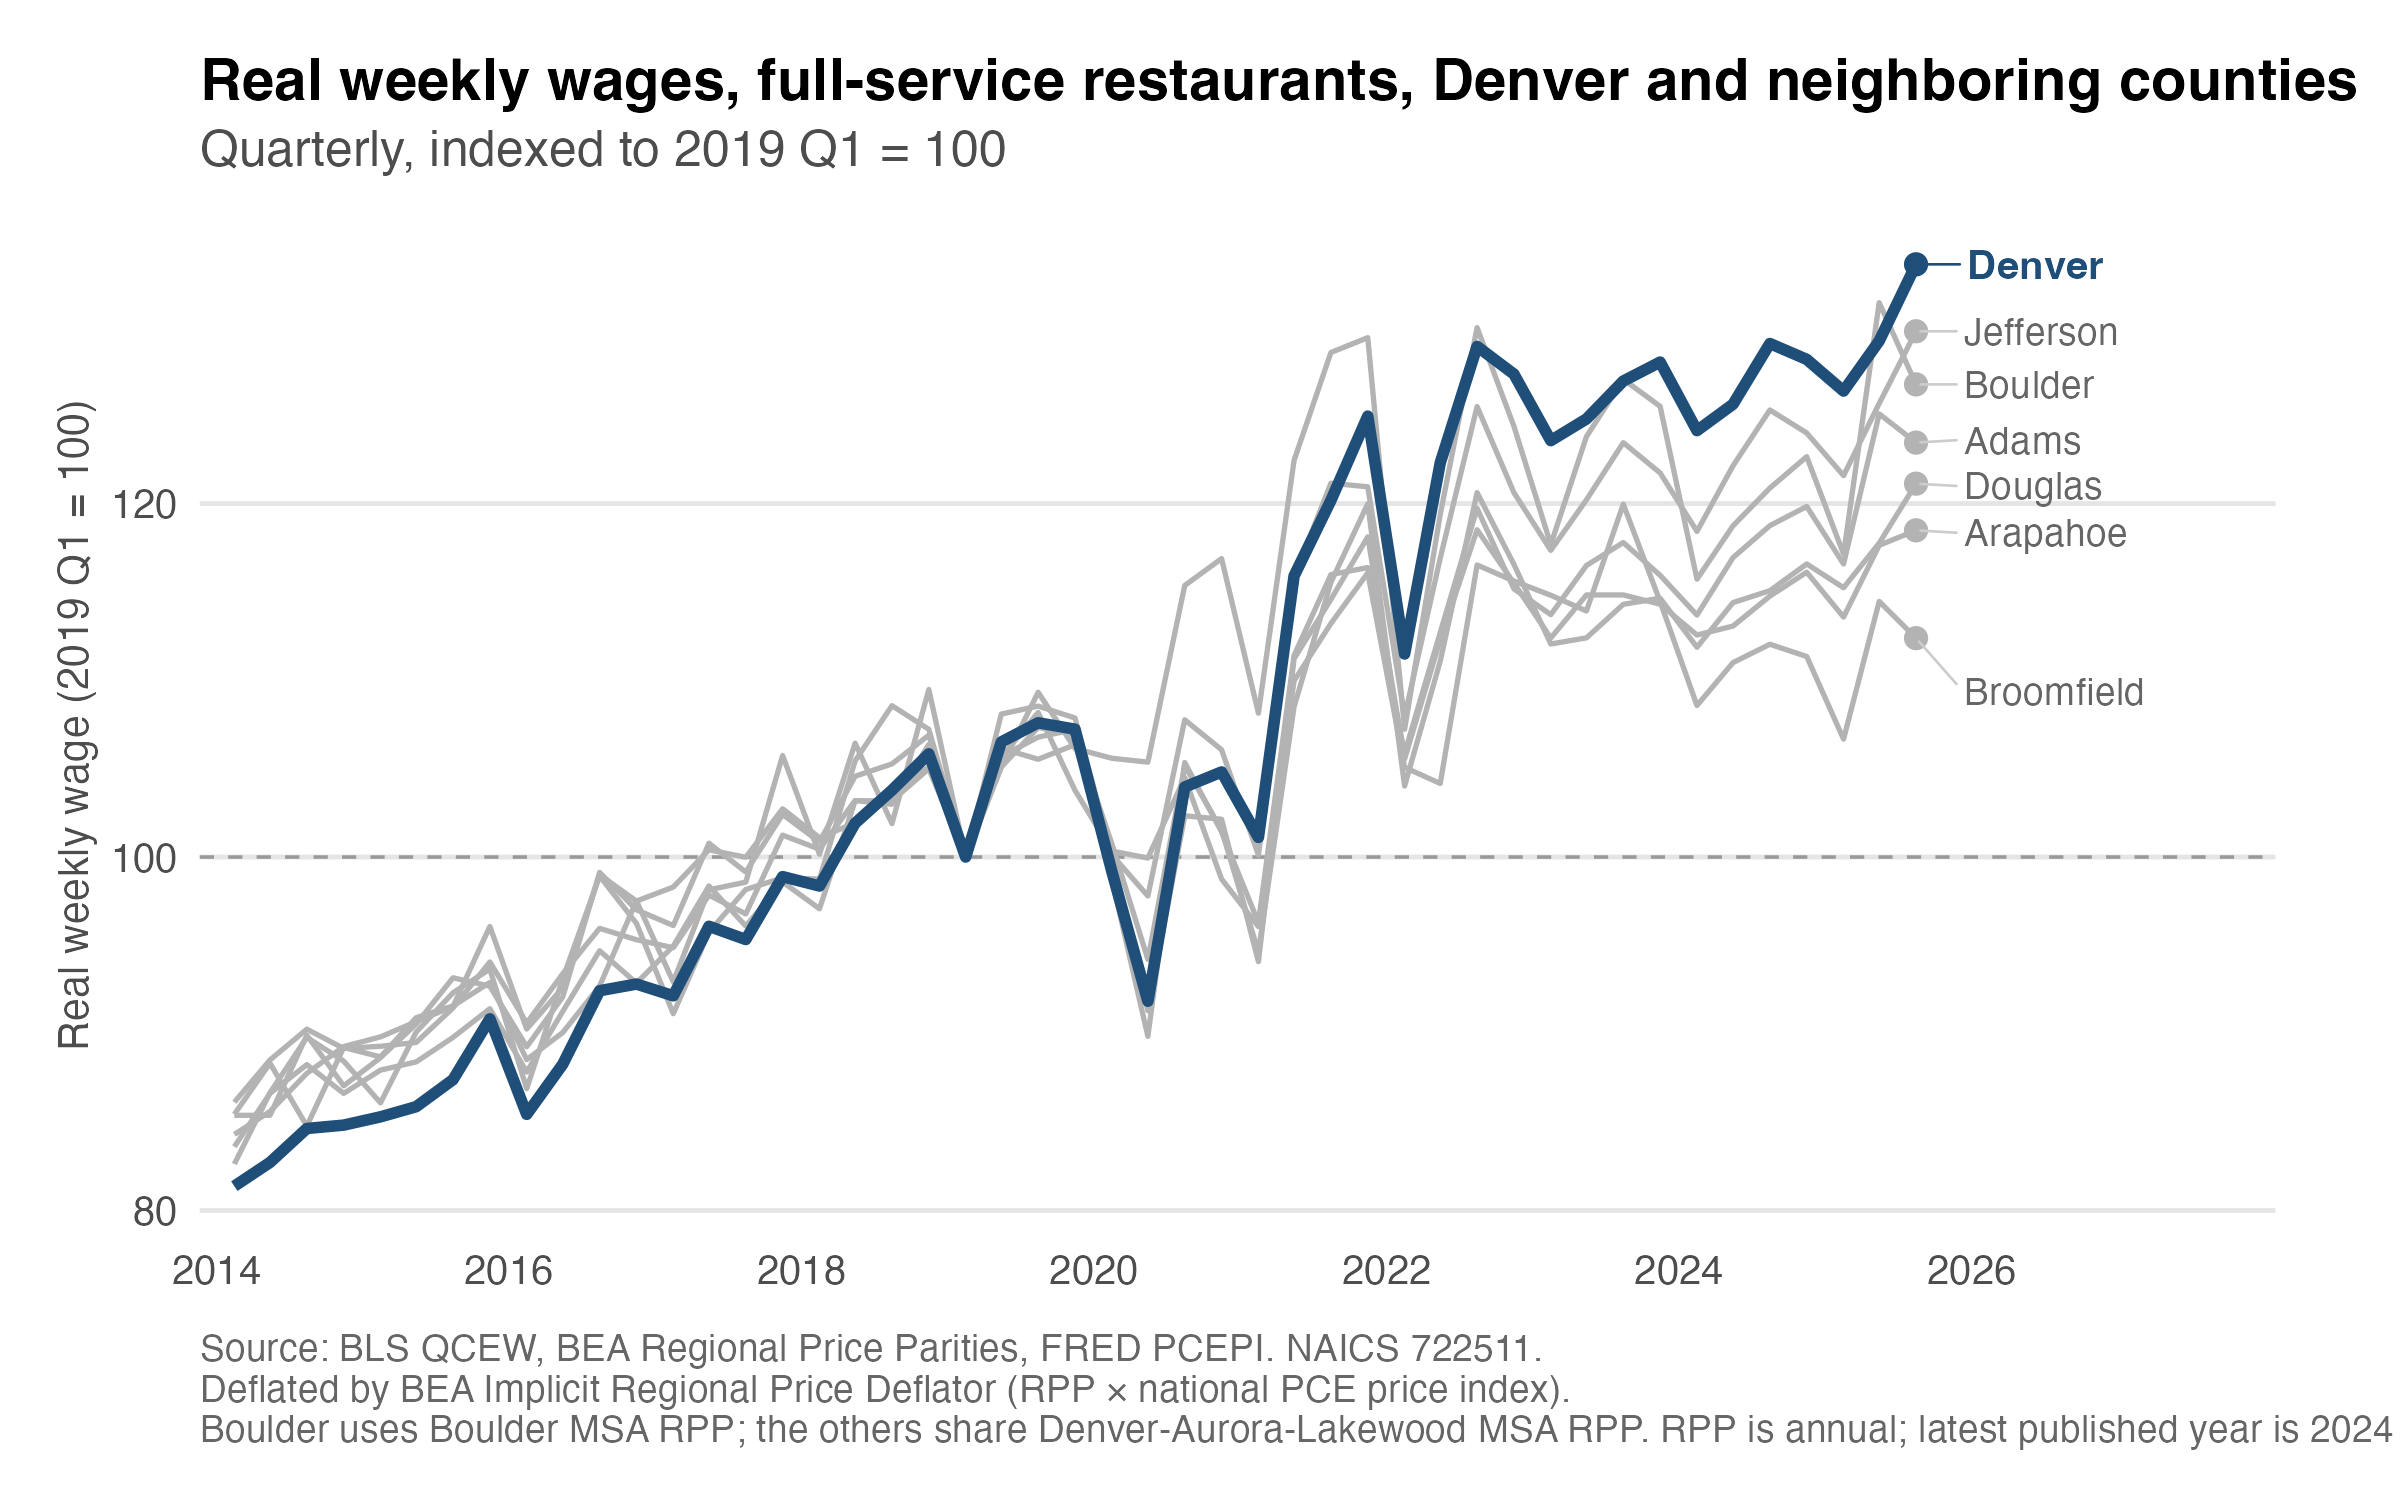
The first comparison shown in the chart below is between Denver county and neighboring counties which include Adams, Arapahoe, Boulder, Broomfield, Douglas, and Jefferson. Despite some declines during the height of the pandemic, all counties have experienced real wage growth relative to their levels at the start of 2019. But Denver leads the pack with around a 30% increase in wages relative to 2019. Keep in mind this is adjusted for inflation, so I am not simply capturing wages going up with prices in general. So at least among nearby counties, Denver stands out in the growth of its labor costs.
Now, let’s turn to comparing Denver to several peer counties including Davidson, Hennepin, Multnomah, Salt Lake, and Travis shown in the next chart. Note that labels correspond to the largest city in each county. The comparison is broadly similar to what was shown for neighboring counties. All counties have experienced growth in restaurant workers’ wages, but Denver leads the pack.
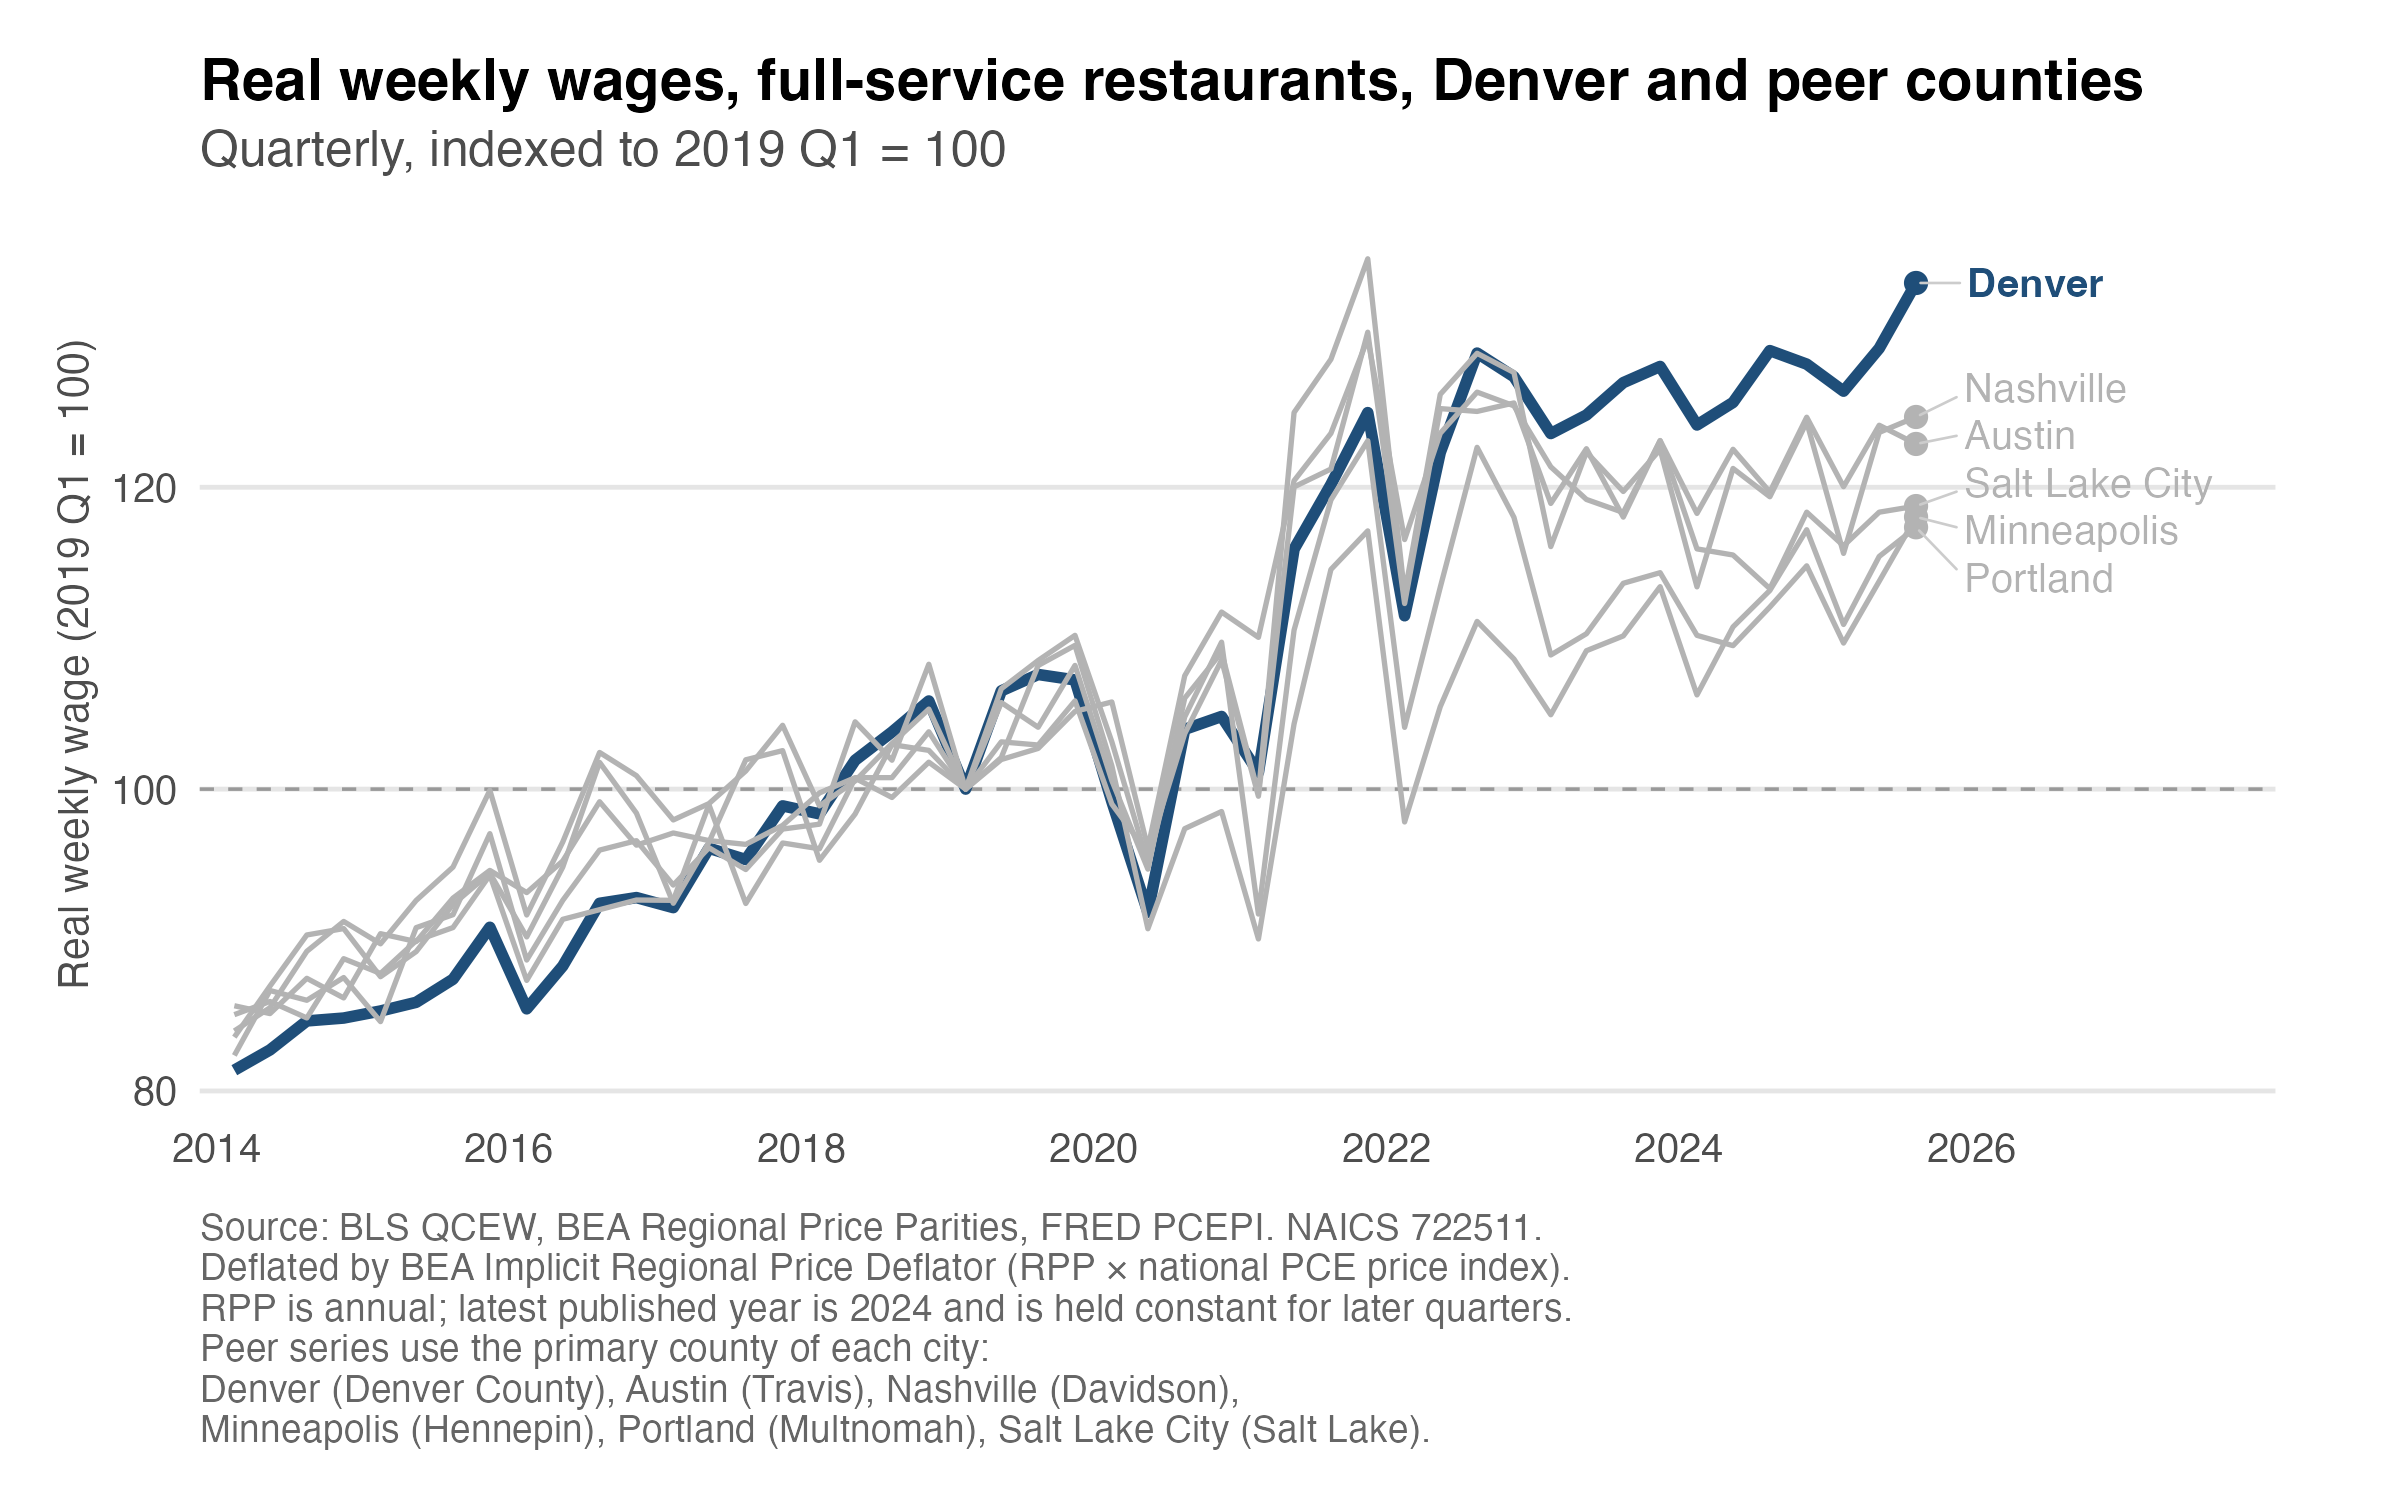
The comparisons paint a clear picture. Denver’s restaurant workers have achieved substantial wage growth since 2019 and at a level that stands out among its neighbors and some comparable counties. Next is to try to understand to what extent this can be attributed to the minimum wage.
Denver’s Minimum Wage
Before assessing to what extent the rise in real wages is associated with the minimum wage, I want to briefly discuss the basic economic theory of minimum wage policy and the surrounding empirical literature on these effects.
First, let’s go over the effects of a minimum wage using the textbook model of a competitive labor market. For those unfamiliar with the supply and demand framework, this is a labor market where labor demand (the employer side of the market) is downward sloping, labor supply is upward sloping, and their intersection determines the going wage rate in that labor market. Employers will hire more labor hours the lower wages are (labor demand is downward sloping). Employees will work more labor hours the higher wages are (supply is upward sloping).
Absent any minimum wage policy, the market wage is determined by supply and demand. A minimum wage is a price floor in this market, and when it is set at a level above the wage determined by the intersection of labor demand and supply, we have a situation where employers are willing to hire fewer employee hours at this wage than workers are willing to work. The basic prediction of this model is that wages go up but the total number of hours hired in the market goes down.
The negative impact on employment is a directional prediction of the model. We’d need to know about the demand and supply curves and the minimum wage to get a better idea about the size of the impact on employment. However, this is also not the only model used to predict effects of the minimum wage. In a model where employers have market power, a minimum wage can increase employment and wages. How we decide which model’s predictions are correct is an empirical question.
Over the last few decades a sizable and increasingly sophisticated empirical literature in economics has found a range of effects of minimum wages in different contexts. In some cases, there appears to be no short-run effect on employment as in the famous Card-Krueger study. Others find positive effects and still others have found negative effects.
Arin Dube and Ben Zipperer created a database calculating what they call the own-wage-elasticity (OWE) which represents the percentage change in employment divided by the percentage change in minimum wage to arrive at a summary number of the impact of the minimum wage (see, Dube’s post introducing the database).2 Even when looking only at estimates compiled on studies from the U.S. for retail or restaurant workers, estimates range from large and negative to large and positive. But because each study is dealing with a different context and different increases in the minimum wage it is difficult to make any general empirical claims about the effects of the minimum wage. That does not mean, however, that no claims can be made about the empirical effects of the minimum wage. I’ll turn now to Denver’s local minimum wage which has been higher than the Colorado minimum wage since 2020.
Denver’s increases in the minimum wage since 2020 are not moderate especially when compared to increases in Colorado’s minimum wage (both tipped and non-tipped) as shown in the table below. And even if we restricted our attention to the labor market for restaurant employees, a reasonable assumption is that the market is competitive. So, as an initial prediction given these two facts, I would say the minimum wage likely causes some decrease in employment hours.
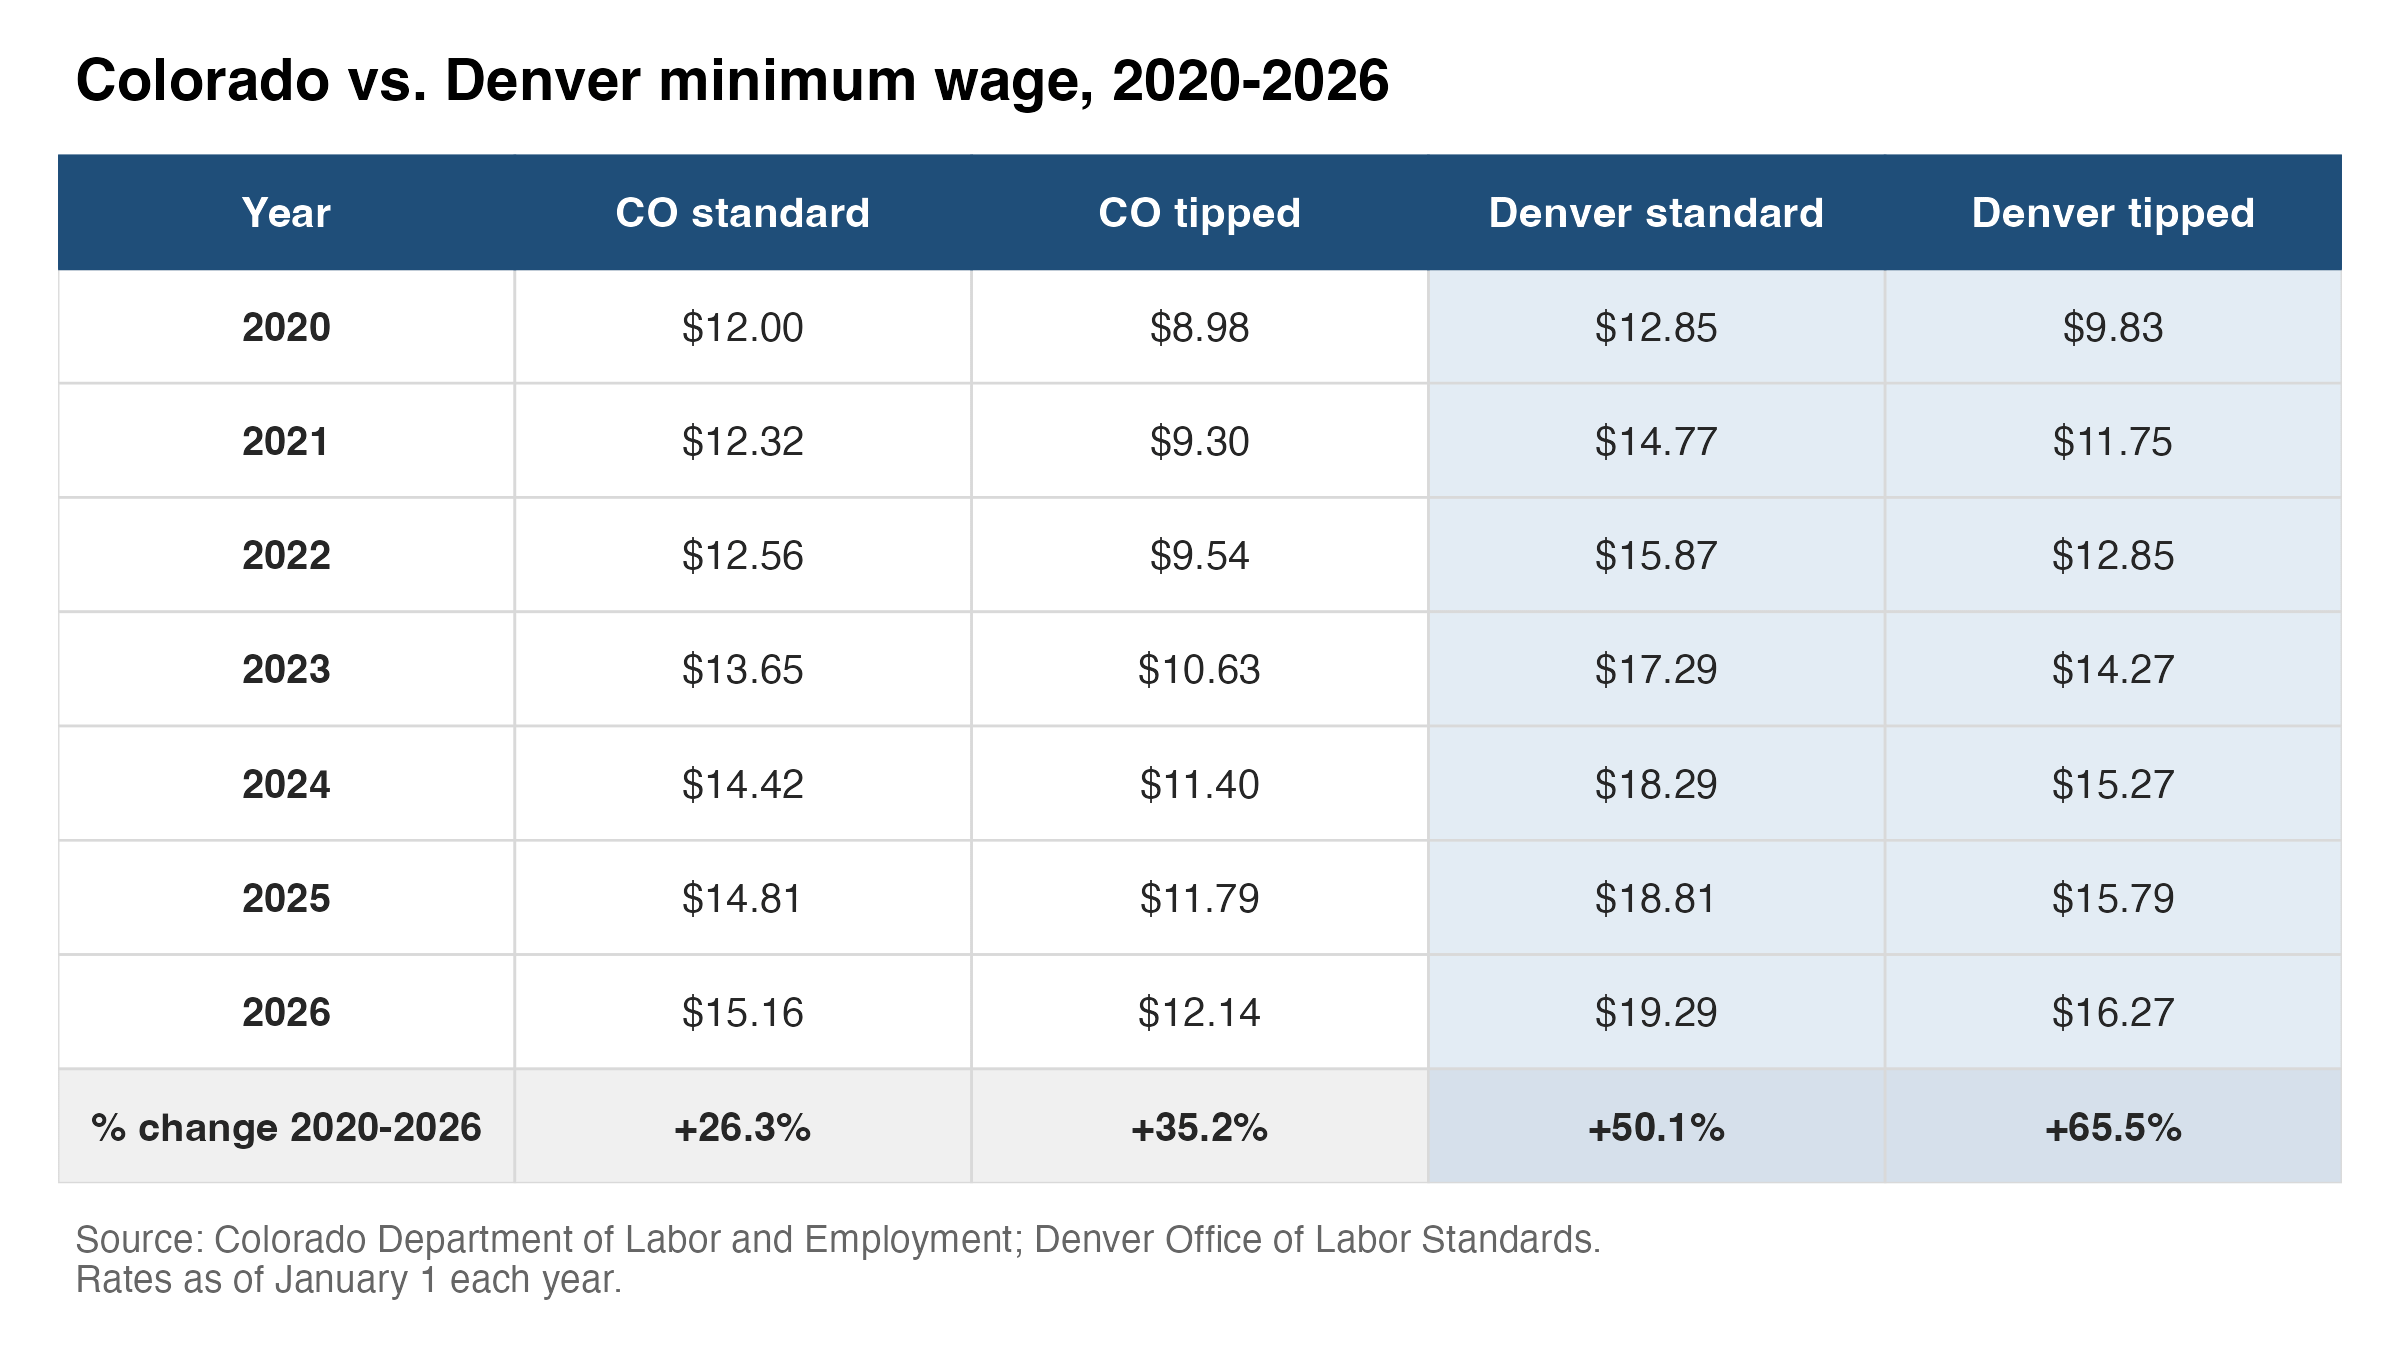
The minimum wage table above also shows a substantial difference in the growth of Denver’s tipped minimum wage relative to the city’s standard minimum wage (about a 15 percentage point difference). This on its own is going to cut against full-service restaurants more than it would for limited-service restaurants. Another relevant factor to consider here is how the employer side of the market responds to minimum wage increases over time. It has now been six years since Denver increased its minimum wage from the Colorado state level. And as Brian Albrecht points out, because demand is more elastic in the long run, we should expect the size of the employer response to minimum wage increases to grow over time. That is, the longer a minimum wage increase is in effect, the larger any downward adjustment in labor use among employers should be.
Put it this way, if you are a restaurant employer and the minimum wage increases it is unlikely that you are going to drastically cut employee hours the next shift or even during the quarter the increase occurs. But the longer that higher wage is in effect, the more you will adjust. Maybe you hire fewer seasonal workers or don’t rehire when an employee leaves. Maybe only the best of your staff get put on the schedule full-time going forward. This long-run adjustment framing will matter for how I think about the divergence between full-service and limited-service later in the post.
Estimating Minimum Wage Effects in Denver
At this point, we know restaurant workers’ wages are high in Denver and have grown more than surrounding counties. The minimum wage has also increased substantially over the last several years. But how much of the increase in real wages is attributable to the increase in the minimum wage? To answer this question, I’ll refer to another recent Substack post from Arin Dube which gave me the idea. In his post, Dube looks at several red states that adopted higher minimum wages and compares them to other states which stayed at the federal level as a natural experiment. The setup is straightforward, he looked at the differences in wages and employment between the states that did and did not adopt higher minimum wages before and after the adoption year. Then, the gap after the minimum wage increase gives some idea of wage changes that can be attributed to the minimum wage and the same for employment.
Luckily for me, Colorado presents a similar scenario where I can use this approach. With the exception of Boulder, Denver is the only nearby county to adopt a minimum wage above the state level in 2020. Denver is my treated county and the surrounding counties Adams, Arapahoe, Broomfield, Douglas, and Jefferson serve as the controls who stayed at the Colorado minimum wage. Denver and the surrounding counties also share a state policy environment that might affect restaurant operators’ labor decisions, such as Colorado’s FAMLI (covering things like maternity and paternity leave) and the state’s sick-leave policy. All of these counties also experience similar inflation. Any gap in wages and employment found between Denver and its neighbors should reflect factors specific to Denver, with the local minimum wage being the most obvious candidate.
Then, we can look at the evolution of restaurant wages and employment in Denver relative to the counties that did not adopt a local minimum wage and see what the gap looks like. To the extent that there is a positive gap in wages we can be more sure that wages are rising because of the minimum wage. Similarly, to the extent that there is a negative gap in employment, we can be more sure that the minimum wage is causing a decline in employment.
A brief note on what this is not. I am not presenting a rigorously specified empirical strategy to recover a causal estimate. There are some clear issues with this setup that would threaten clean identification. Edgewater, one of the cities that does have a higher than Colorado minimum wage, is in Jefferson county but is being treated as a control. That poses the threat of downward bias on the estimated growth in wages due to the minimum wage in Denver. Also, the state minimum wage has not been fixed since 2020; it has just grown more slowly than Denver’s. The “control” counties are therefore not genuine controls. They did have increases in the minimum wage, just smaller increases than took place in Denver. Because of this, we should expect bias toward zero for any wage and employment effects estimated. However, this approach should be more informative than the naive comparisons earlier in the post in part because if there are substantial increases in wages and substantial decreases in employment relative to surrounding counties, we should expect that those would be more pronounced using a cleaner control set.
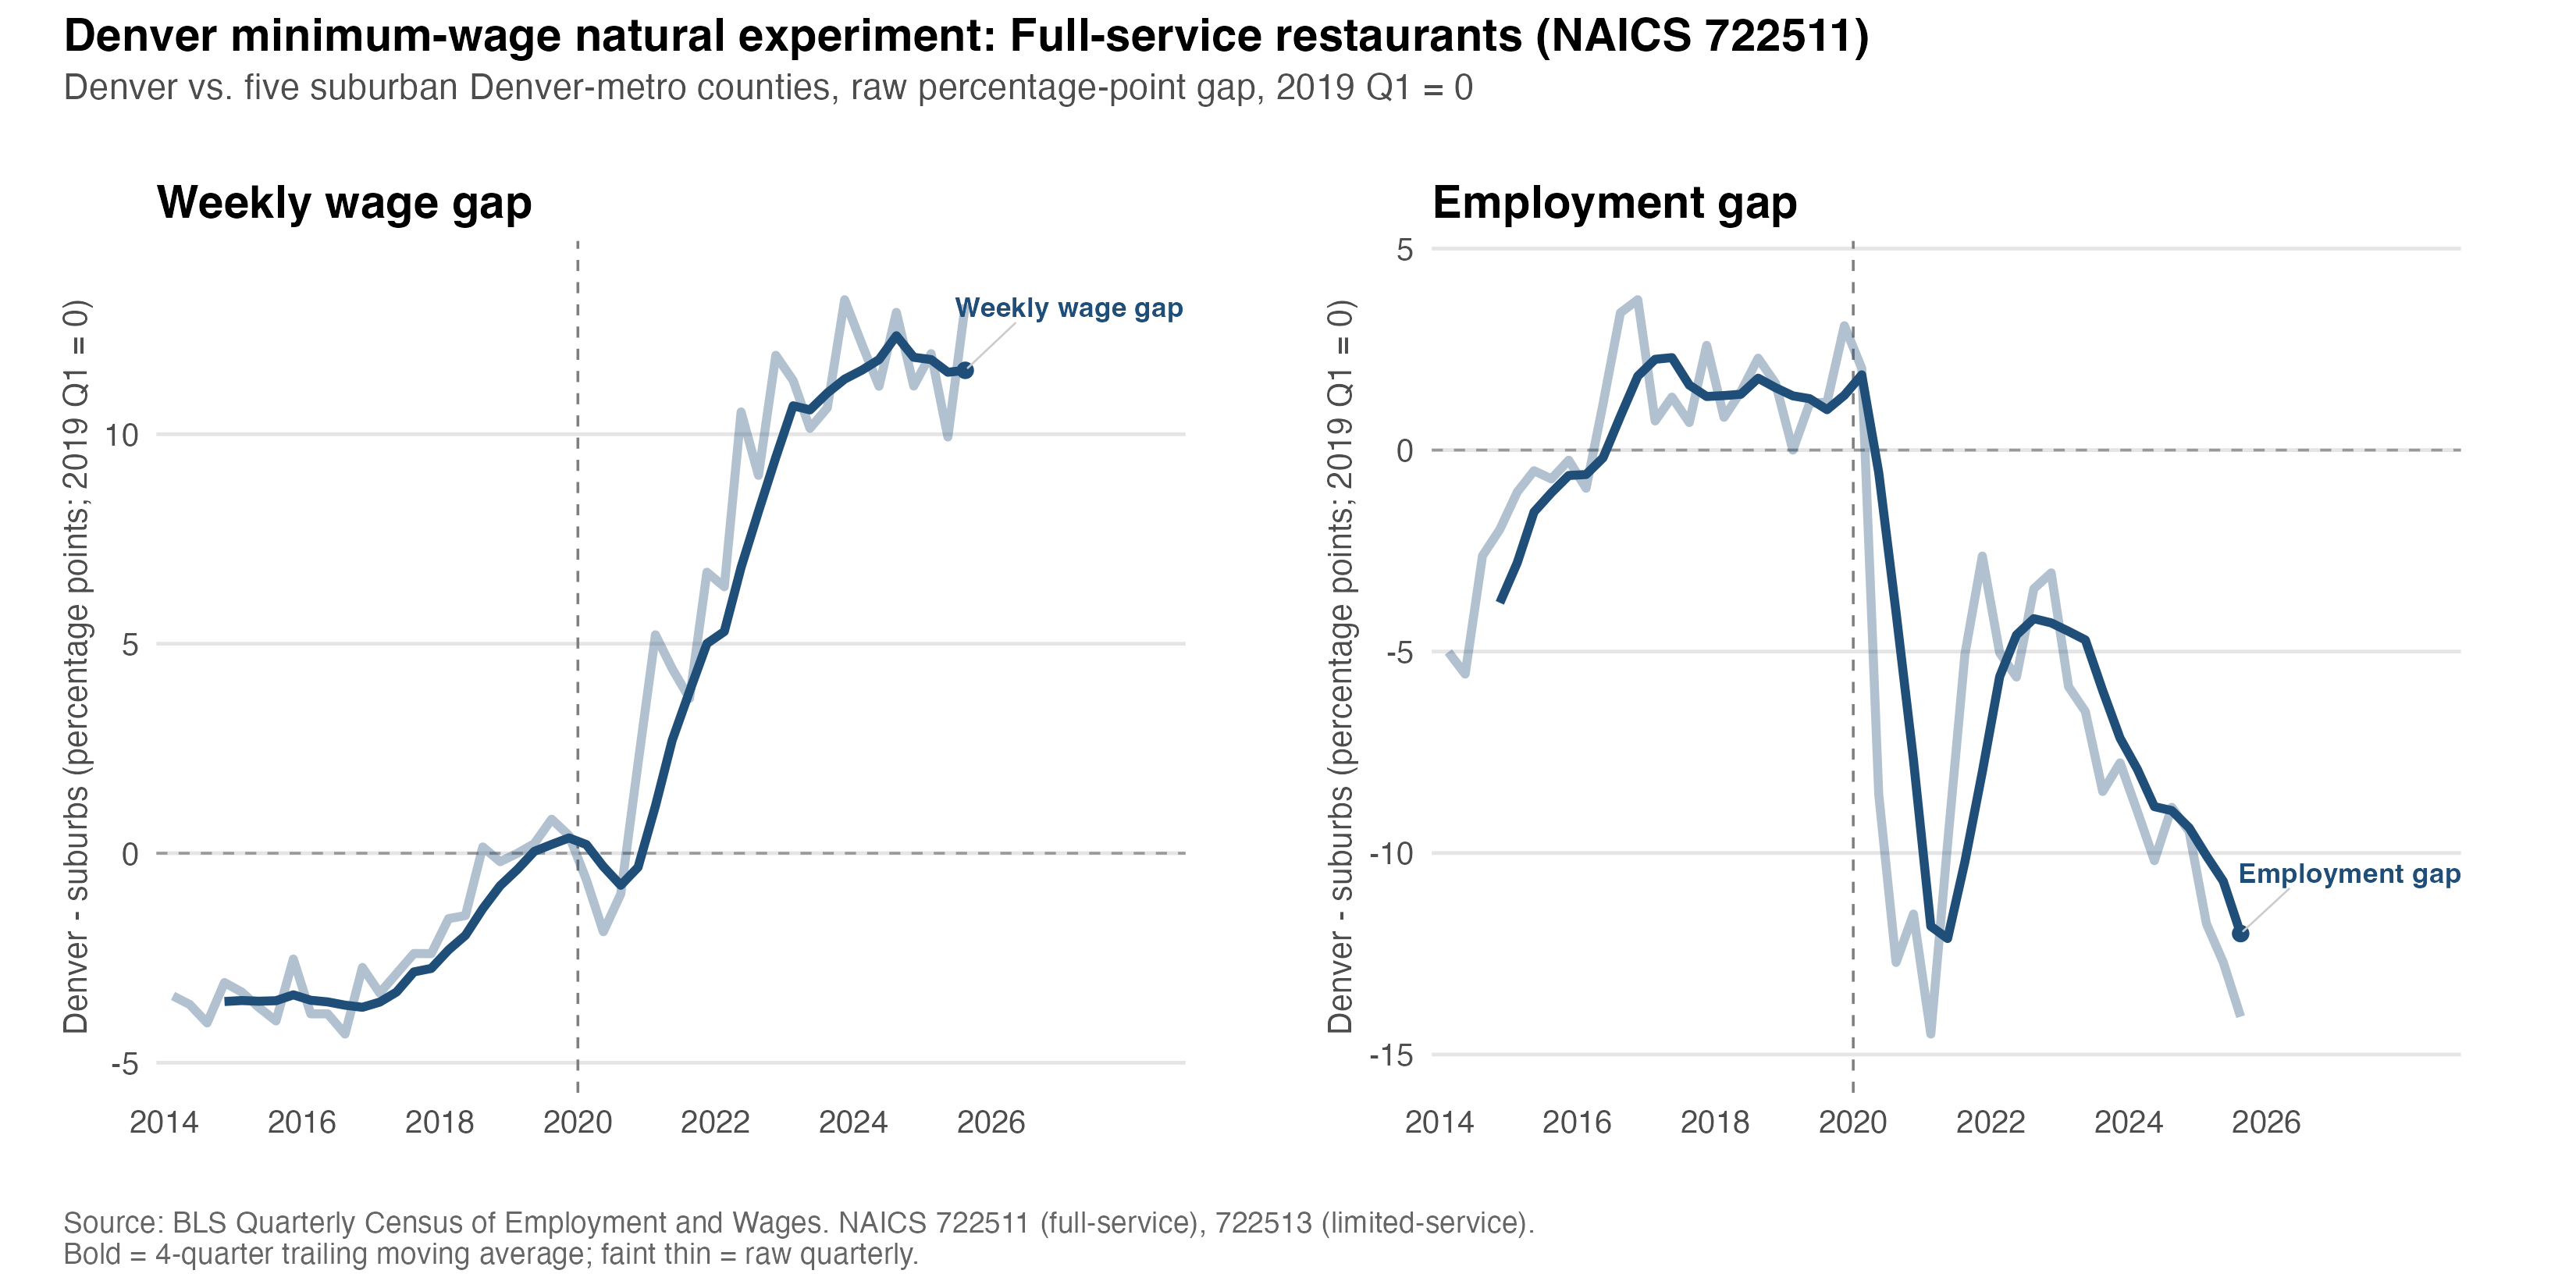
The chart below shows the side-by-side results for this approach on full-service restaurant wages and employment. Both are set to 0 in Q1 2019, and what we see for wages is that by late 2025, real wages for full-service restaurant workers in Denver had grown about 12 percentage points more than wages in surrounding counties relative to their 2019 levels. This gap is consistent with Denver’s minimum wage increases driving a meaningful share of Denver’s recent wage growth, though how much exactly is not clear. The right-hand panel shows substantial declines in restaurant employment at the same time wages are rising. By late 2025, full-service restaurant employment in Denver was more than 10 percentage points lower than employment in surrounding counties relative to 2019.
Again, I won’t pretend these are causal estimates. We have some evidence that Denver’s restaurant workers’ wages increased as the minimum wage increased and more so than neighboring counties that stayed on the lower state minimum wage. We also have evidence that restaurant employment declined over the same period and substantially more than in neighboring counties. This pushes me closer to believing that the minimum wage increases in Denver can explain some of the decline in the restaurant industry.
From the perspective of restaurant owners, this means they could face a few dollars an hour difference in labor costs per employee when determining to open in, say, the city of Wheat Ridge in Jefferson County or in Denver. That doesn’t imply that most operators are going to choose Wheat Ridge just to save on labor costs. Foot traffic differs across these locations and the hit to the consumer base may be more than enough to offset labor cost savings, but this will matter on the margin. Operators have a clear cost incentive to open restaurants in surrounding counties and opt out of Denver.
What About Limited-Service Restaurants?
The remaining piece of the puzzle though is why limited-service restaurants are not doing as poorly. Higher labor costs can explain why Denver restaurants under-perform those in surrounding counties, but not the full-service vs. limited-service divergence. Now, I will get back to the long-run elasticity point to present a hypothesis. More adjustment on the labor-demand side doesn’t just mean that full-service restaurants use less labor and that some eventually exit because they can’t make it. It might also mean that additional adjustments are being made to have a more permanent reduction in labor use. And one way to do this is to adjust the business model of the restaurant before it opens.
I’ll start with the premise that full-service restaurants tend to be more labor-intensive businesses than limited-service restaurants. A full-service restaurant will have to hire wait staff, hosts, cooks, people to clear tables, dishwashers, etc. Maybe in the face of higher labor costs, operators begin to combine employee tasks. Wait staff handles clearing tables, and there are no busboys. There is no host position and wait staff handles customers as they come in. Cooks double as dishwashers. But even with some expansion of job duties to cut down on staff, we should expect limited-service restaurants to have fewer employees on average.
Limited-service restaurants still have cooks and people to handle orders at the cash register but there is no wait staff, no need for hosts, and combining tasks is relatively easier. Cashiers can collect trays and clear off tables when there are lulls in the line (customers might even handle some chunk of this). Shifts can overlap, so cashiers handle other tasks toward the end of their shift and the employee coming in takes over at the register. Luckily, the QCEW data I have been using across these two posts does allow me to at least present a proxy for the sort of labor intensity I am describing here.
The proxy measure I have in mind is simply average employees per establishment by restaurant type. That is, the employee headcount divided by the number of establishments for both full-service and limited-service restaurants. Admittedly, this measure is not perfect. Restaurants of both types will vary in how many employees they have, and headcount might overstate labor intensity. For example, a restaurant with more part-time employees may appear more labor-intensive than one with fewer (but more full-time) employees putting in the same total hours. But as shown in the chart below, there is a clear and persistent gap in the average number of employees per restaurant across types.
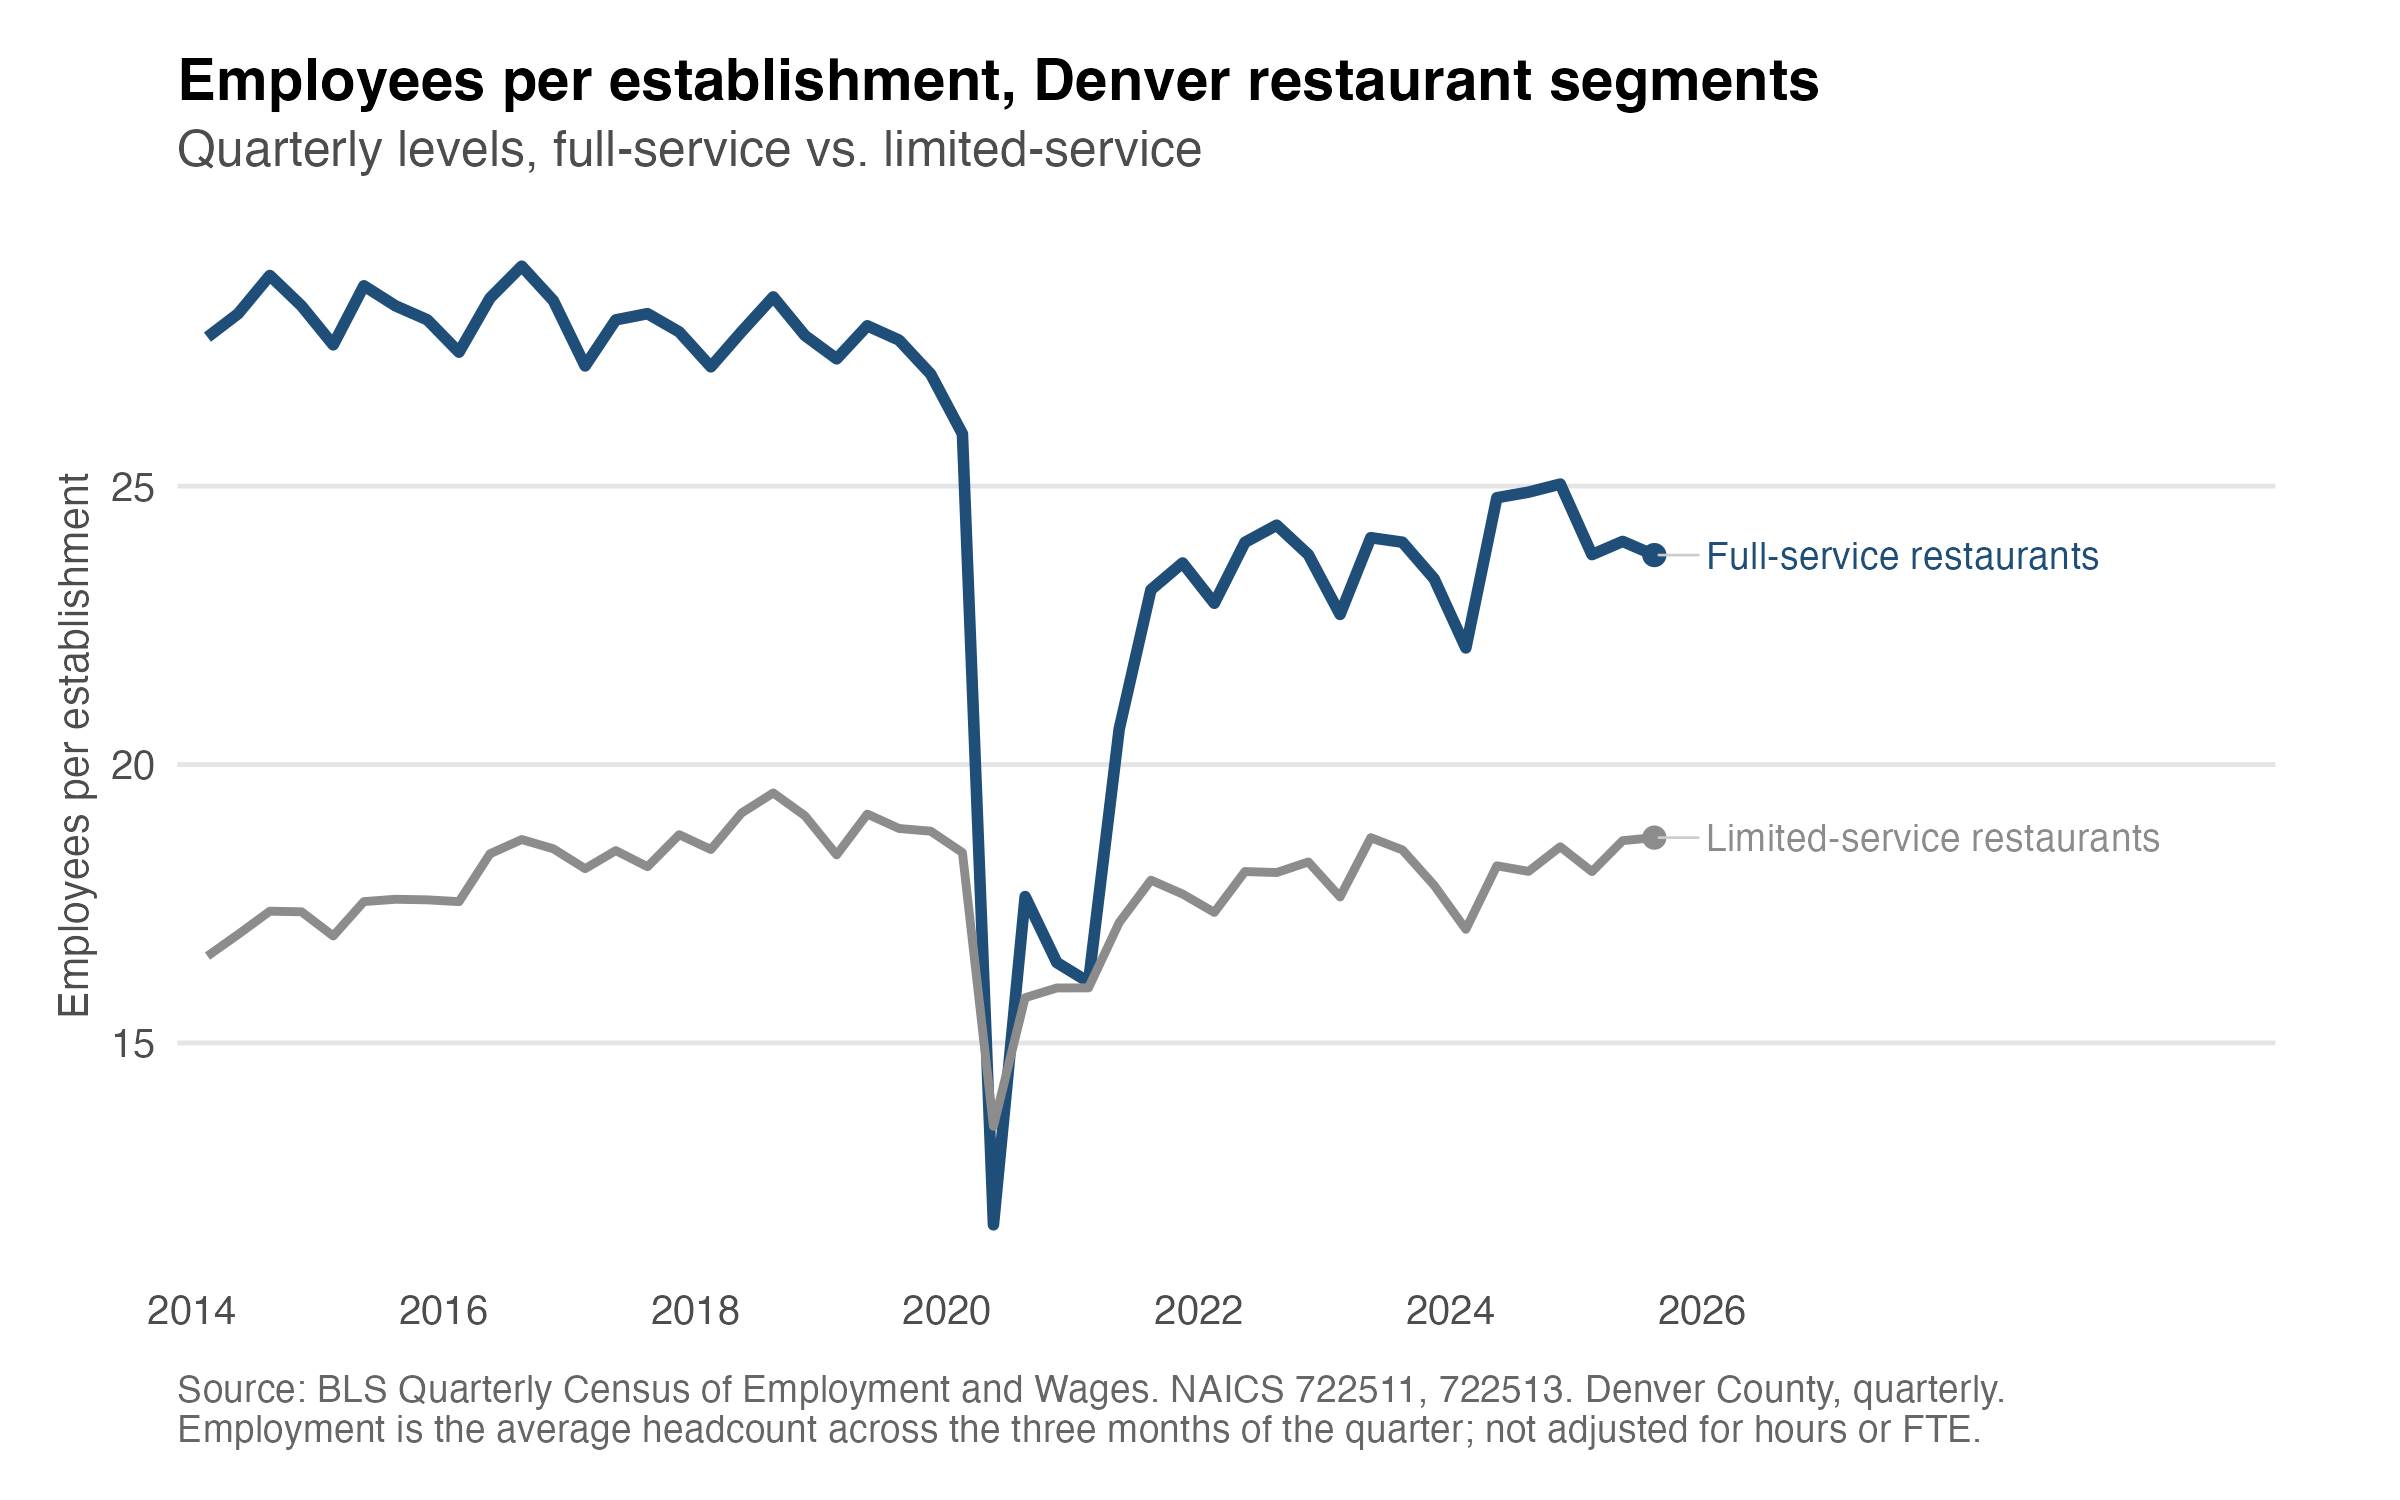
Prior to the pandemic, this gap was much larger. Full-service restaurants had around 9 more employees per restaurant than limited-service restaurants on average. Since the pandemic, the gap remains but has shrunk. Full-service restaurants now have something closer to 5 more employees per restaurant than limited-service restaurants. The gap shrinking is consistent with the idea that full-service restaurants have had to figure out how to combine tasks or adjust to operating with fewer employees. However, it is also consistent with larger restaurants exiting and leaving behind more full-service restaurants that hire fewer employees, even without any task combination. The persistent gap across restaurant types is consistent with the starting premise that operating a full-service restaurant tends to be more labor-intensive than operating a limited-service one, even if task adjustments or some other factor have occurred to shrink the gap. And if full-service is more labor-intensive than limited-service, then a minimum wage increase raises full-service operating costs by more than limited-service costs in percentage terms.
With this difference in labor intensity across restaurant types in mind, let’s imagine someone looking to open a restaurant. Our restaurateur plans to open a full-service restaurant and she starts thinking about hiring. She will need to hire wait staff, cooks, a manager, and maybe hosts. Each of these employees must be paid at least the minimum wage or the tipped minimum wage depending on their role. After doing some back-of-the-envelope calculations, she sees how much revenue she’d have to bring in to break even with these costs and realizes it just won’t work. The restaurant would have to be a massive success just to cover costs.
At this point, our new restaurant owner may just give up but that is not the only option. She could tweak her plan a bit and open as a limited-service restaurant. Why might this be a solution? The restaurant with counter-service can be a way to permanently lower labor costs. The first cut would be to the wait staff. A few people to staff the cash registers, who may also perform other tasks, means fewer people adding to the total wage bill. She still needs cooks and a manager, but overall the total number of employees and working hours can easily be slashed before the restaurant even opens. And in this scenario she still gets to open a version of her restaurant.
The more labor costs rise and the more permanent these changes are, the more likely we should expect this decision to be made. That is one channel through which the long-run adjustment to the minimum wage increase can take place.
The difficulty with this hypothesis is that it’s not clear how or where it would show up in the data. It is unlikely that there are many full-service restaurants making the switch to limited-service. But if that were happening, I am not aware of a dataset that would allow me to see something like reclassification from full- to limited-service. Similarly, I am not aware of any dataset at the county level with detailed industry classification for gross flows of establishments. And what I have in mind is at the stage of planning or getting ready to open a new restaurant, some operators are opting to go with the limited-service model. This isn’t something that would be captured in any data that I am aware of.
The best I can do with the data I have is to do the same “natural experiment” comparison done for full-service this time for limited-service and see the wage and employment gaps for limited service in Denver compared to surrounding counties that adhere to the state minimum wage. This evidence will not tell me whether more operators are choosing limited-service. What it does do is allow me to see whether wages for limited-service workers have risen relative to surrounding counties more or less than was the case for full-service restaurants.
If the relative wage increases are less, then limited-service restaurants are not only less labor-intensive but also less costly to operate in Denver relative to surrounding counties, making the monetary incentive for adjustment clearer. The minimum wage might also produce similar increases in wages for limited-service employees as it did for full-service employees. Even in this case, however, there is still a difference in cost hit. As discussed above, there is a persistent gap in labor intensity across restaurant types.
If my hypothesis is correct, I would also expect any declines in employment in the limited-service sector to be weaker than those found for full-service. But if both wage gains and employment declines are close to the same for limited-service, it’s unlikely this entry-adjustment idea is correct. At best, this is evidence of the shift in incentives between operating a full-service and a limited-service restaurant, not the outcomes predicted by my hypothesis.
The chart below shows the side-by-side comparison of wages and employment for limited-service restaurants in Denver relative to the neighboring counties. The left panel suggests that wages for limited-service restaurant workers have risen similarly to those in full-service, 10 percentage points for limited-service compared to 12 percentage points for full-service. These numbers are close enough to suggest that the minimum wage has likely affected wages in both sectors equally. The changes in employment are not the same, however. Although in the most recent periods there is a negative employment gap, it is much smaller than the one for full-service restaurants. Limited-service restaurant employment is around 4 percentage points lower in Denver than in surrounding counties as of late 2025. The same figure for full-service employment was more than 10 percentage points lower.
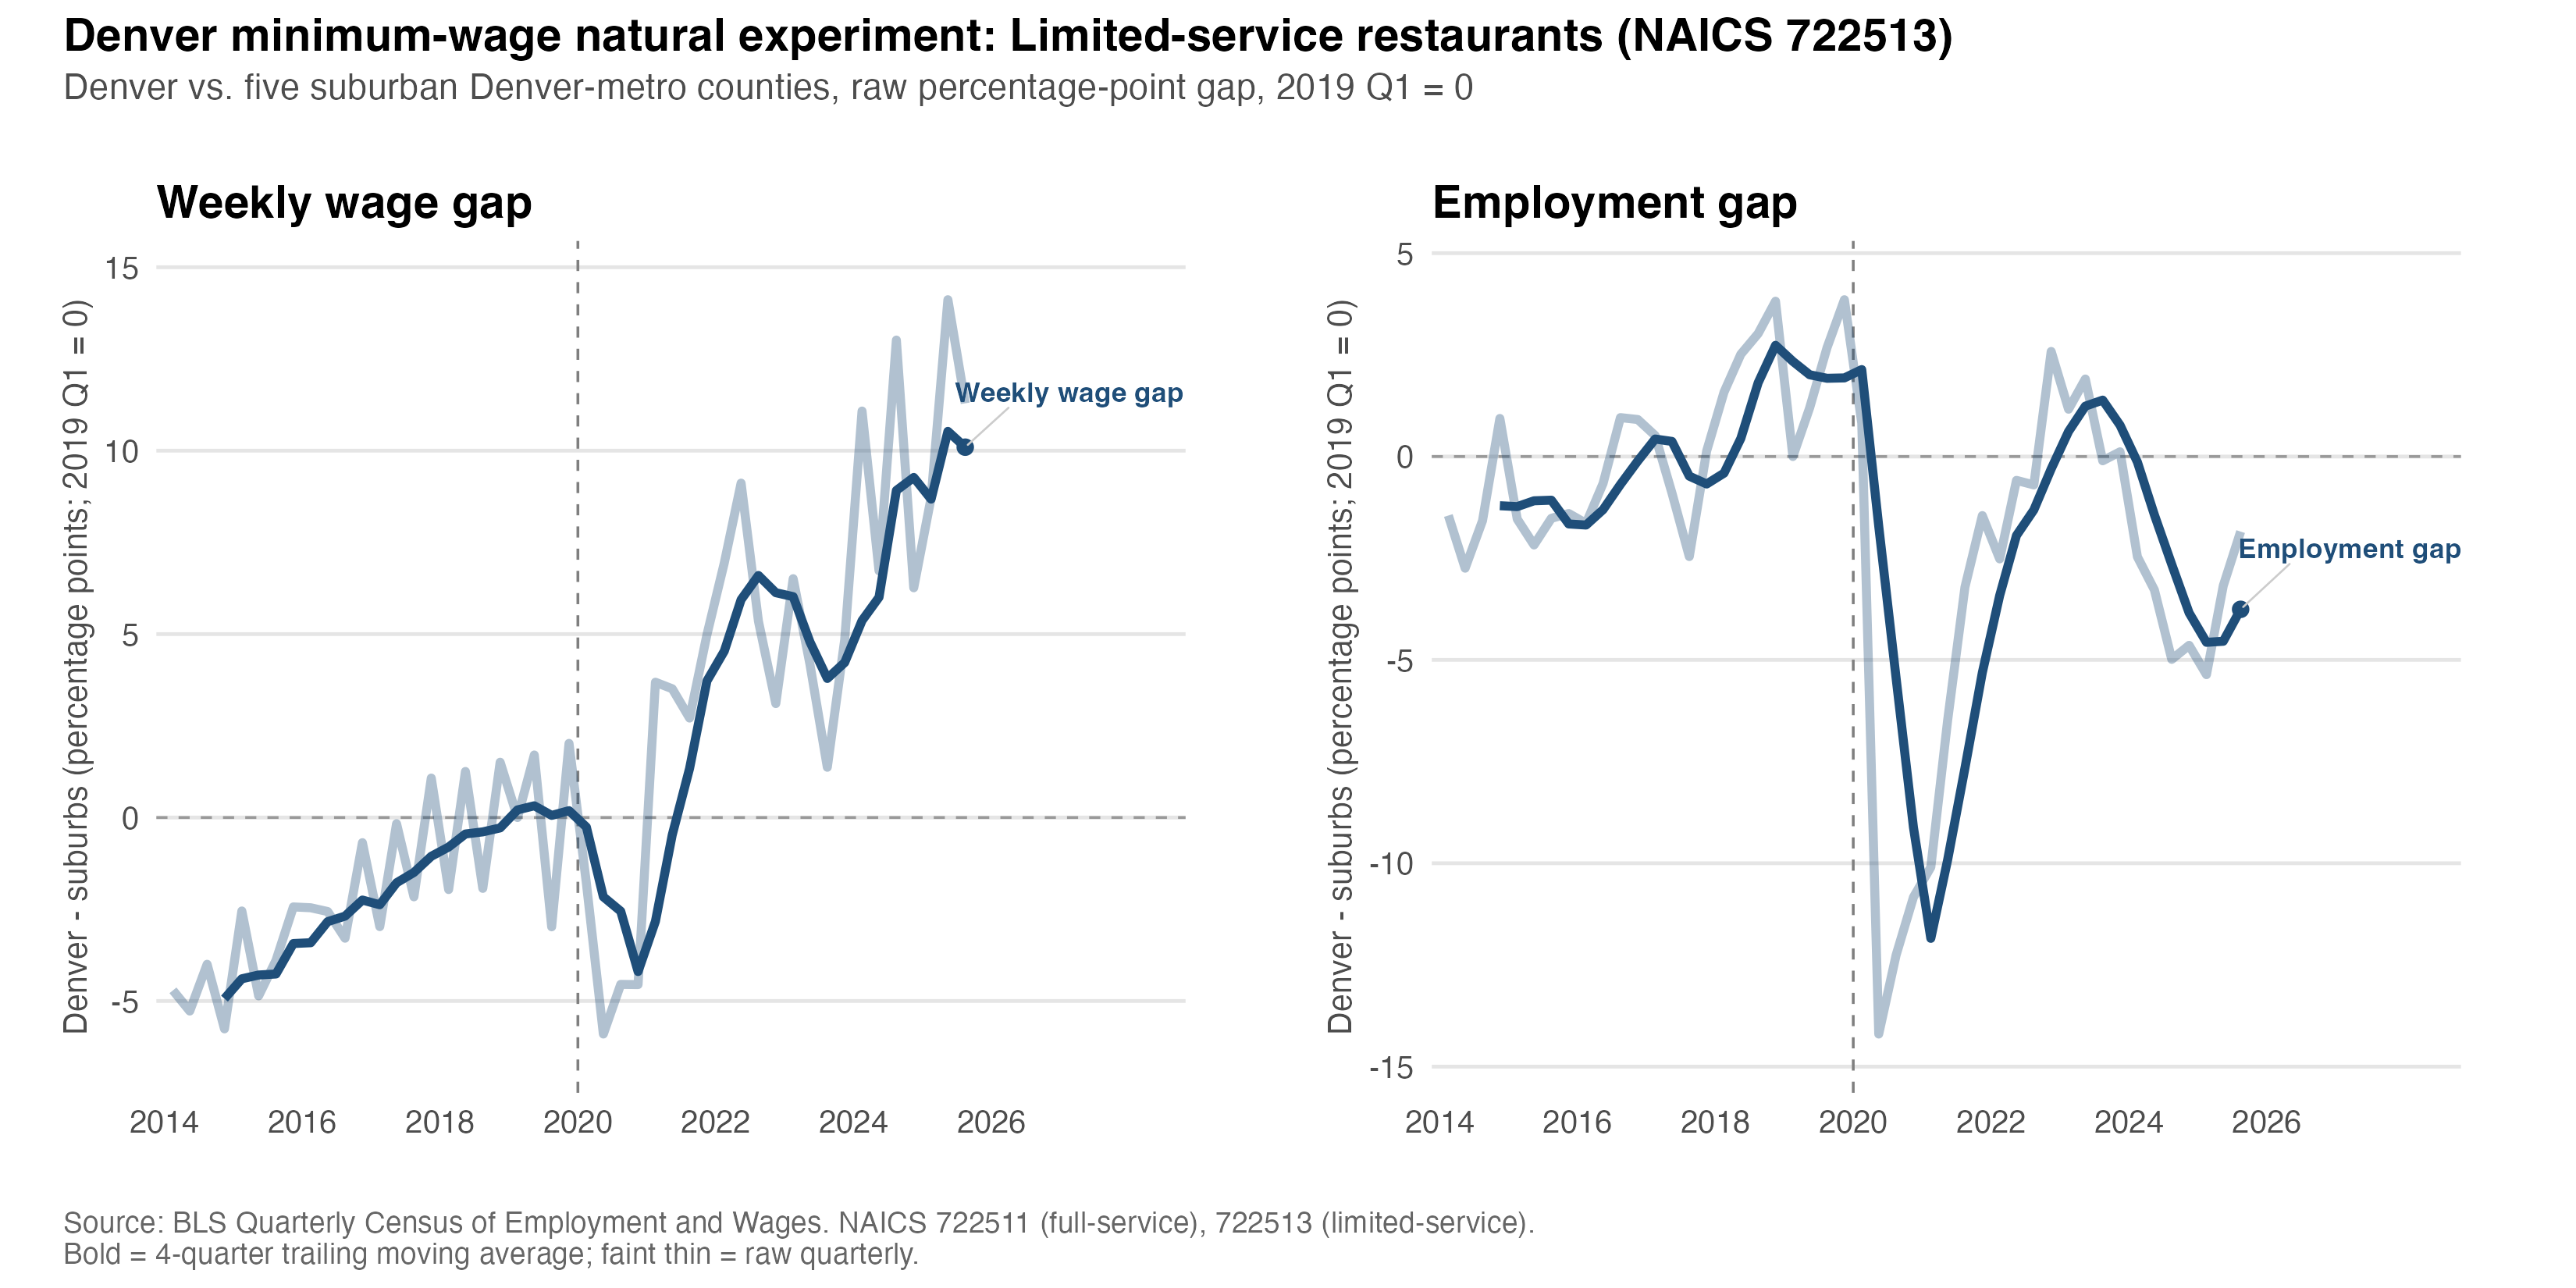
The wage finding shows the minimum wage affected per-worker pay in full-service and limited-service about equally. But because full-service restaurants employ more workers per establishment (even as employment has declined for full-service), the total cost per restaurant is larger for full-service. The cost advantage of limited-service has only widened as Denver’s minimum wage has risen, consistent with the hypothesis that the divergence across restaurant sectors can also be partly explained by the minimum wage. If someone is looking to open a restaurant in Denver, the incentives are pointing toward a limited-service business model.
What to Do?
Where does this leave us? Even without a clean causal estimate, the evidence is consistent with Denver’s minimum wage increases lifting restaurant wages above what surrounding counties saw and weighing on restaurant employment. There is also evidence that this is not affecting limited-service restaurants to the same extent. Together, the evidence suggests that both the distinct problem of Denver’s restaurants and the divergence across sectors of the restaurant industry can be partly explained by Denver’s minimum wage.
There is a limit to what this means for policy though. Even if I think that the broader market for low-wage labor in Denver is competitive and the recent increases in the minimum wage have been large enough to cause employment declines more generally, the evidence shown here is strictly on restaurants and even within that sector there is variation. I wouldn’t confidently say that Denver should revert the minimum wage to the state level because the story may not be the same in different areas.
But the Colorado state legislature passed a law last year which would allow cities like Denver to bring their tipped minimum wage closer to the state level. Governor Polis explicitly called on Denver and other cities in Colorado with higher minimum wages to address the tip credit when this law passed. Given what I have shown here this is a reasonable policy. Denver’s tipped minimum wage being lowered to the state level will probably provide some relief to full-service restaurants. And if we wanted restaurants to be doing better, the seemingly obvious response would be to do this. The problem, however, is that this seems politically unpopular. As far as I know, there hasn’t been any formal discussion of this issue in the Denver City Council yet but advocacy groups and over 50 restaurants have already urged the city not to reduce the tipped minimum wage. Maybe there is some support and this will happen but I’m not optimistic.
Despite the seeming unpopularity, I want to make the case that lowering Denver’s tipped minimum wage is limited in scope and worth taking a chance on. Tipped workers are concentrated in the restaurant industry and lowering the tipped minimum wage limits the scope of impact. It also doesn’t necessarily lead to an outcome where restaurant workers, especially those who are typically tipped, go through a decline in wages. The tip credit already operates so that employers must make up the difference if a tipped worker’s base wage plus tips falls below the non-tipped minimum wage. So, the minimum wage floor is still there. What changes is who pays for the floor, employers or customers. Restaurant operators can also choose to pool tips or eliminate tipping. Some will do this and can pay their wait staff the higher non-tipped minimum wage. Other operators will choose the lower tipped minimum wage and allow tips. Workers can then figure out which is the better deal, and job switching will occur over time.
If Denver does revert to the Colorado tipped minimum wage, I would not expect a rapid recovery in full-service restaurants. The downward adjustment took time and so would any recovery. Maybe this new equilibrium with fewer full-service restaurants is fine, but I wouldn’t mind seeing more restaurants popping up. Denver is an underrated food city, and making it easier for operators to experiment and provide consumers with more options would be great to see.
There are a couple limitations to using the RPP values here to adjust for more local infaltion than the national PCE price index alone: 1) RPPs are only available annually, I am using the same value for every quarter in a given year, and 2) They are constructed at the MSA-level not the county level which the wage data is at.
Arin Dube’s post explaining OWE in more detail is linked above but for quick reference: When OWE is less than or equal to -1, an increase in the minimum wage is more than offset by the decrease in employment (low-wage workers are generally worse off). When OWE is greater than -1 (even if still negative), low-wage workers are better off. And here is a link to the database.