


I moved to Denver after graduate school, and before my wife and I made the move people would ask us about plans to get into skiing or hiking, typical Colorado stuff. I was definitely excited about doing more outdoor activities, but was most excited about exploring the food options in a new city. My wife and I love trying new places and after living in the D.C. area for five years, we were interested to see what Denver had to offer. It wasn’t long before we found a wide variety of restaurants in and around Denver with awesome food. I even started putting a note in my syllabus encouraging students to email me their favorite restaurants in the area for a little extra credit so we always had new places to try.
Sadly though, we arrived in Denver in what appears to be a period of struggle for the city’s restaurant industry. In the few years we have been here, many places we enjoyed eating at have closed, some after not even a year of being open. One example is EatYa Pizza, which used to be on the 16th Street Mall and was only open for 9 months. EatYa was excellent. Roman style pizza by the slice with unique toppings at a decent price. I could walk over there from my office for lunch to grab a couple slices and have a better lunch than the sandwich I usually bring from home. It was somewhere I took people when they came into town to visit or just to grab dinner to-go and eat at home.
EatYa was not a one-off closure it seemed. Even just along the 16th Street Mall since living here other restaurants have come and gone including a great Asian spot (YumCha). Local reporting over the last few years has brought up again and again and again that both consumers and operators are frustrated and feeling like the restaurant industry has gotten more difficult. These problems have become severe enough that Denver Economic Development & Opportunity, Visit Denver, and inKind put together the State of Denver’s Restaurants report which included surveys with operators. You can find the report here. This report is informative, showing restaurant employment is down and costs are up. Although the report covers a lot, the peer-comparisons it makes are mostly about wage policy. Those comparison cities are helpful and I want to extend this to see whether patterns in restaurant employment and establishments are shared across counties in Colorado as well as some peer counties. Then, the minimum wage question and other issues related to cost can be taken up in Part 2. My goal here with the comparisons is to try and get a better sense of how distinct the problem is to Denver and where it might be concentrated within the industry.
We can imagine two possible worlds, in both of which some portion of restaurant owners would rightly feel that surviving in the industry has become more difficult. The first is a genuine slump which could be measured by a decline in the number of establishments. Restaurants are closing and there aren’t new restaurants replacing the ones that close. But the other possibility is that the restaurant industry has a lot of churn. Many restaurants might be closing, but there are new restaurants opening to replace the ones closing. This is not to say that restaurant owners have an easy job. Maybe there are ways the business could be made easier, but the point is that there is a difference between how difficult it is to successfully run a restaurant and how healthy we might consider the industry to be.
In the world where churn is high, turnover isn’t necessarily a bad thing. That is a sign of competition and consumers voting with their dollar on who cuts it for meeting their culinary desires in the city. Not every consumer will be happy in this world, I certainly was disappointed when EatYa Pizza shuttered, but this would be a sign that the Denver restaurant industry is competitive which comes with some harsh realities especially given rising costs. I will also differentiate between full-service and limited-service restaurants to see whether this is an across-the-board problem or specific to one sector of the industry.
As a follow up to this post, I will focus more on the costs side of this issue and policy responses that would make sense for Denver. Over the last couple years there have already been considerations to alter the tipped minimum wage, changes to licensing to make it somewhat easier to open new restaurants, and even the Mayor’s off-the-cuff idea to add a surcharge to restaurant bills and use the revenues to subsidize the businesses. I am sympathetic to some of these (no, not the Mayor’s idea), but I think it is important first that there is a clear sense of the problem before the costs and policy sides are considered.
Data on Denver’s Restaurant Industry
The main source of data I will rely on for this post is the Bureau of Labor Statistics Quarterly Census of Employment and Wages (QCEW). This is some of the same data used in the State of Denver’s Restaurants report linked above. This data is great because it is primarily based on state unemployment tax records rather than surveys which avoids some issues with response rate. My focus will be on looking at restaurant employment and establishments in Denver county and several other counties for comparison. But the QCEW data will also allow me to look at different types of restaurants according to their NAICS classification such as full-service vs. limited-service restaurants (think sit-down service vs. counter service).
The data presented in charts below will not be the raw numbers but values that are indexed to their Q1 2019 value. The purpose here is to establish an easy to interpret pre-pandemic baseline for employment and establishments. For example, if a county’s index reaches 110, employment is 10% higher than its Q1 2019 level and if it fell to 90, then employment is 10% lower. Presenting the data in this way frames the changes in employment and establishments relative to 2019 which is a bit conservative. For instance, if there was employment growth leading up to 2019 and then a decline during the pandemic, some might not consider there to be true recovery unless employment returns back to pre-2019 trends or might see Q1 as seasonally low employment. As presented here, however, I will consider a return to the 2019 level as recovery which will likely understate the problem to a degree. All the charts below show quarterly data going back to the first quarter of 2014 through the third quarter of 2025 (the latest available data from QCEW).
Restaurant Employment in Denver and Neighboring Counties
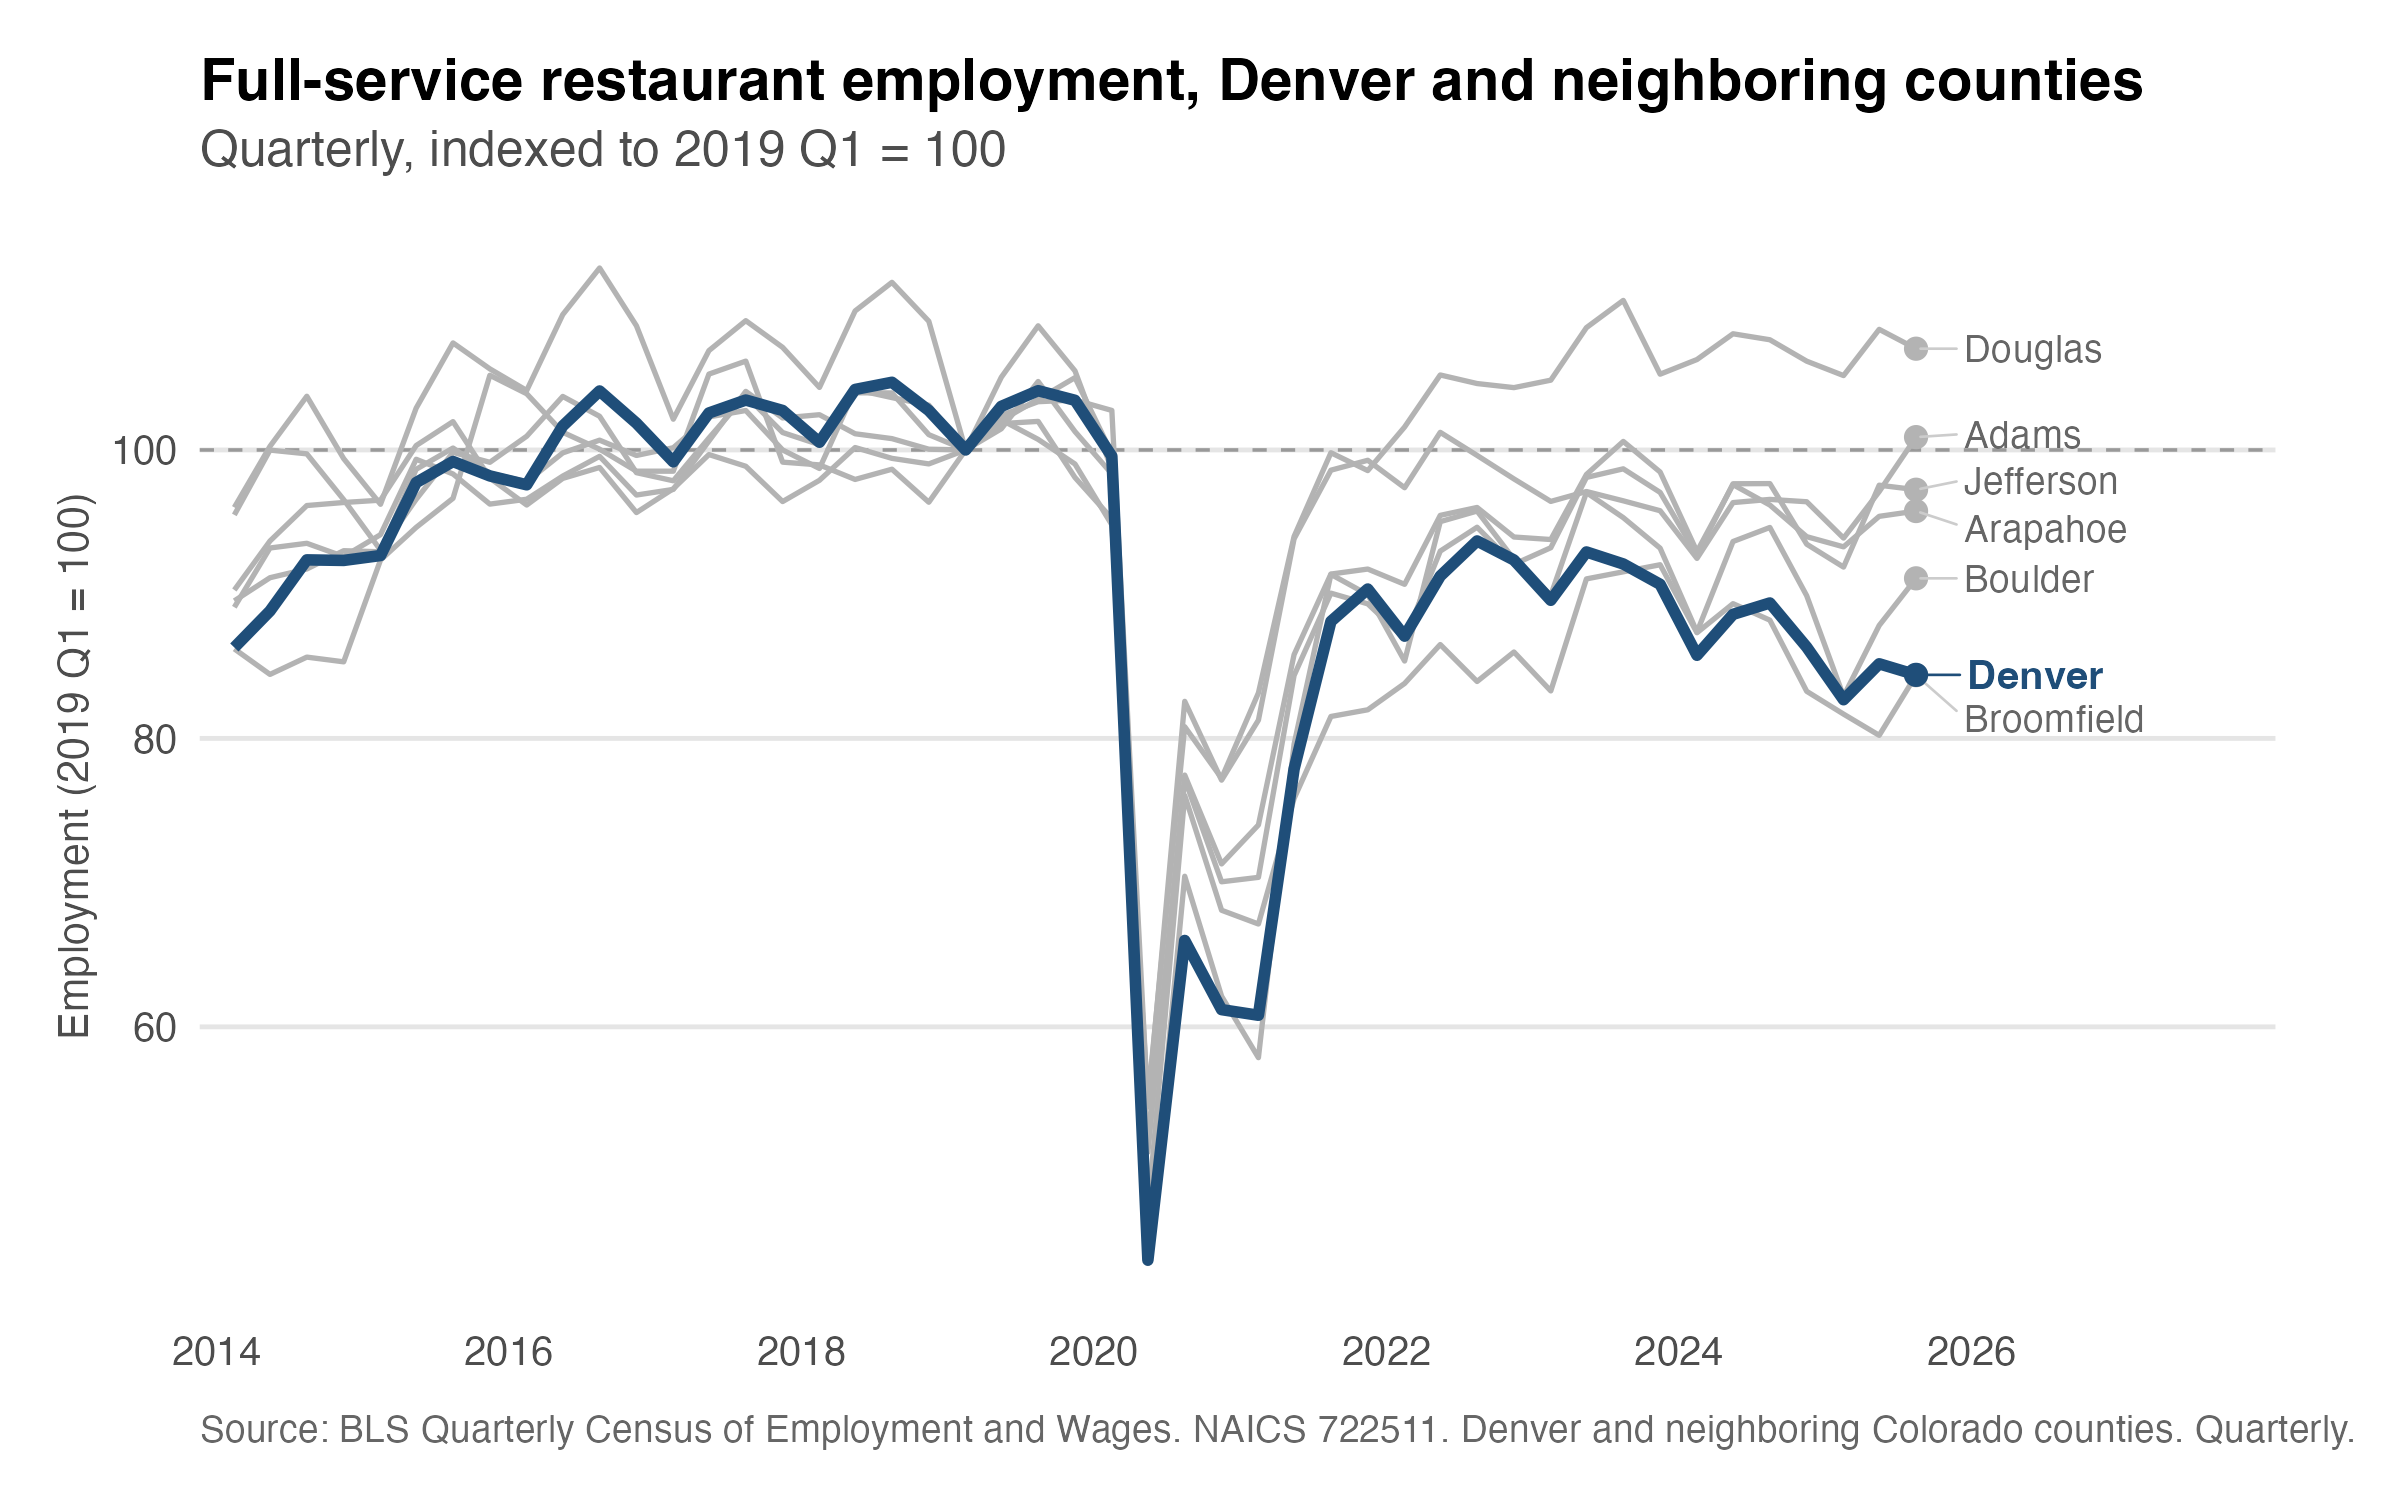
The first indicator we will look at is restaurant employment. The chart below plots employment in full-service restaurants for Denver and several surrounding counties. Relative to 2019, all counties show a similar pattern after 2019. The pandemic hits and restaurant employment craters, then begins to increase rapidly back toward 2019 levels over a short period. But for many of these counties, employment never returns to its pre-pandemic level. For Denver county specifically, employment stayed well below its 2019 levels and then went through another decline between 2022 and 2024 ending around 15% below 2019 employment levels. And when we compare this performance to each county’s performance against its own 2019 baseline, we see that the only other county that has fared as poorly as Denver is Broomfield, the smallest of the surrounding counties.1 Although most counties never recovered to their own 2019 employment levels, none are quite as bad as Denver and Broomfield. Douglas county is a standout that has seen full recovery and then some since 2022.
Employment may be down, but maybe restaurants have gotten better at serving the same number of meals with fewer employees. With things like QR code menus, pay with your phone, and limiting what full-service looks like, this is entirely possible. As take-out, delivery, and counter-service options have become more popular, it might also be the case there has been a shift in the composition of the type of restaurants in Denver toward more limited-service which could partially explain declining employment in the full-service sector.
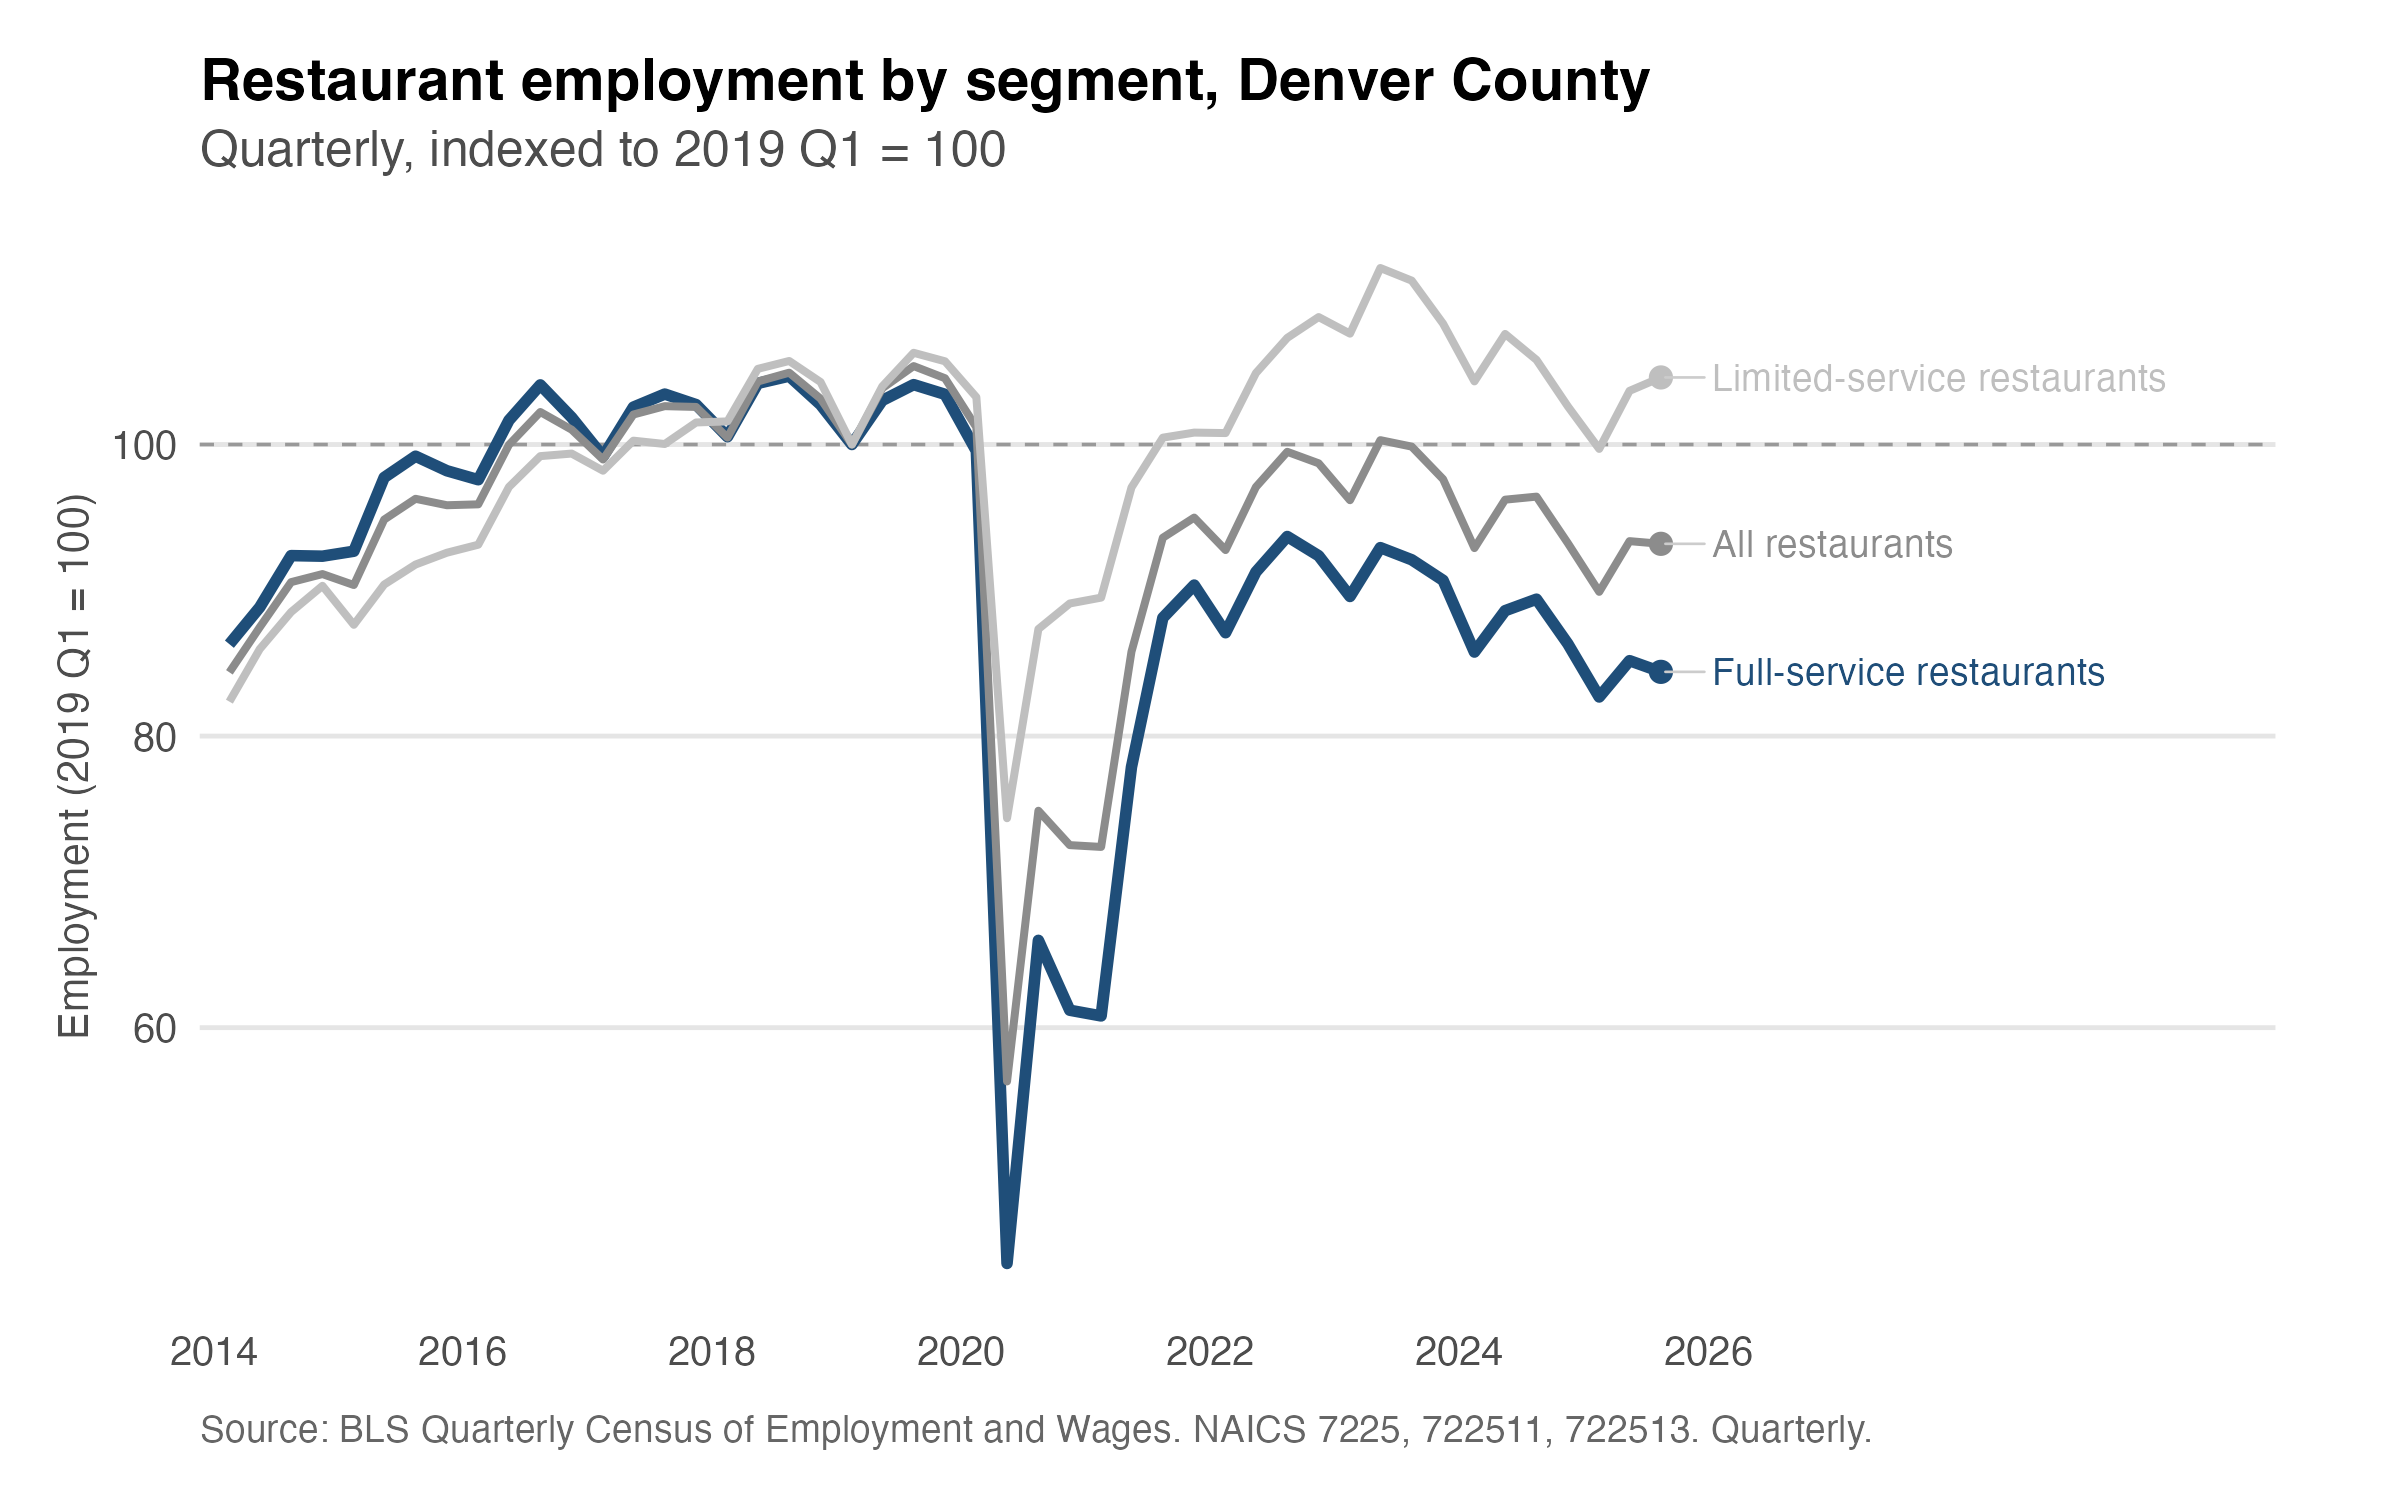
This next chart compares employment in Denver county across two different types of restaurants and restaurant employment in total. Looking first at total restaurant employment, there is still no full recovery to the early 2019 level, but when we look at employment at limited-service restaurants the changes after 2020 look much different. From its low point during the height of the pandemic, limited-service restaurant employment increased back toward its 2019 level and eventually peaked at more than 10% above that 2019 baseline in 2023. Between 2024 and mid-2025, limited-service employment began declining back toward the 2019 level but as of the third quarter of 2025 was still around 5% above the 2019 baseline.
The divergence in employment trends across restaurant types is the first piece of evidence to suggest that not all of Denver’s restaurants are facing the same problem. Things could be better in the limited-service sector but there is no clear slump at least when looking at employment. The slump is more clearly limited to full-service restaurants. With that in mind, we can turn to data on restaurant establishments.
Number of Restaurants in Denver and Neighboring Counties
The establishments data shows the total number of restaurants in whatever county we are looking at. These numbers count multiple locations of the same restaurant individually. Each Illegal Pete’s counts as 1, for example. One thing to note, however, is that because this is total establishments it is not perfect for determining churn or slump. For that, I would need the number of openings and closings each quarter. What I can say with this data is that if the number of total establishments is declining and falling below the pre-pandemic baseline that is clear evidence of a slump. The main limitation is that if there is limited change in the total number of restaurants this would be consistent with either a high churn environment where openings and closings roughly cancel out or where few new restaurants are opening but there are also not many closures. I cannot determine which is the case looking only at totals.
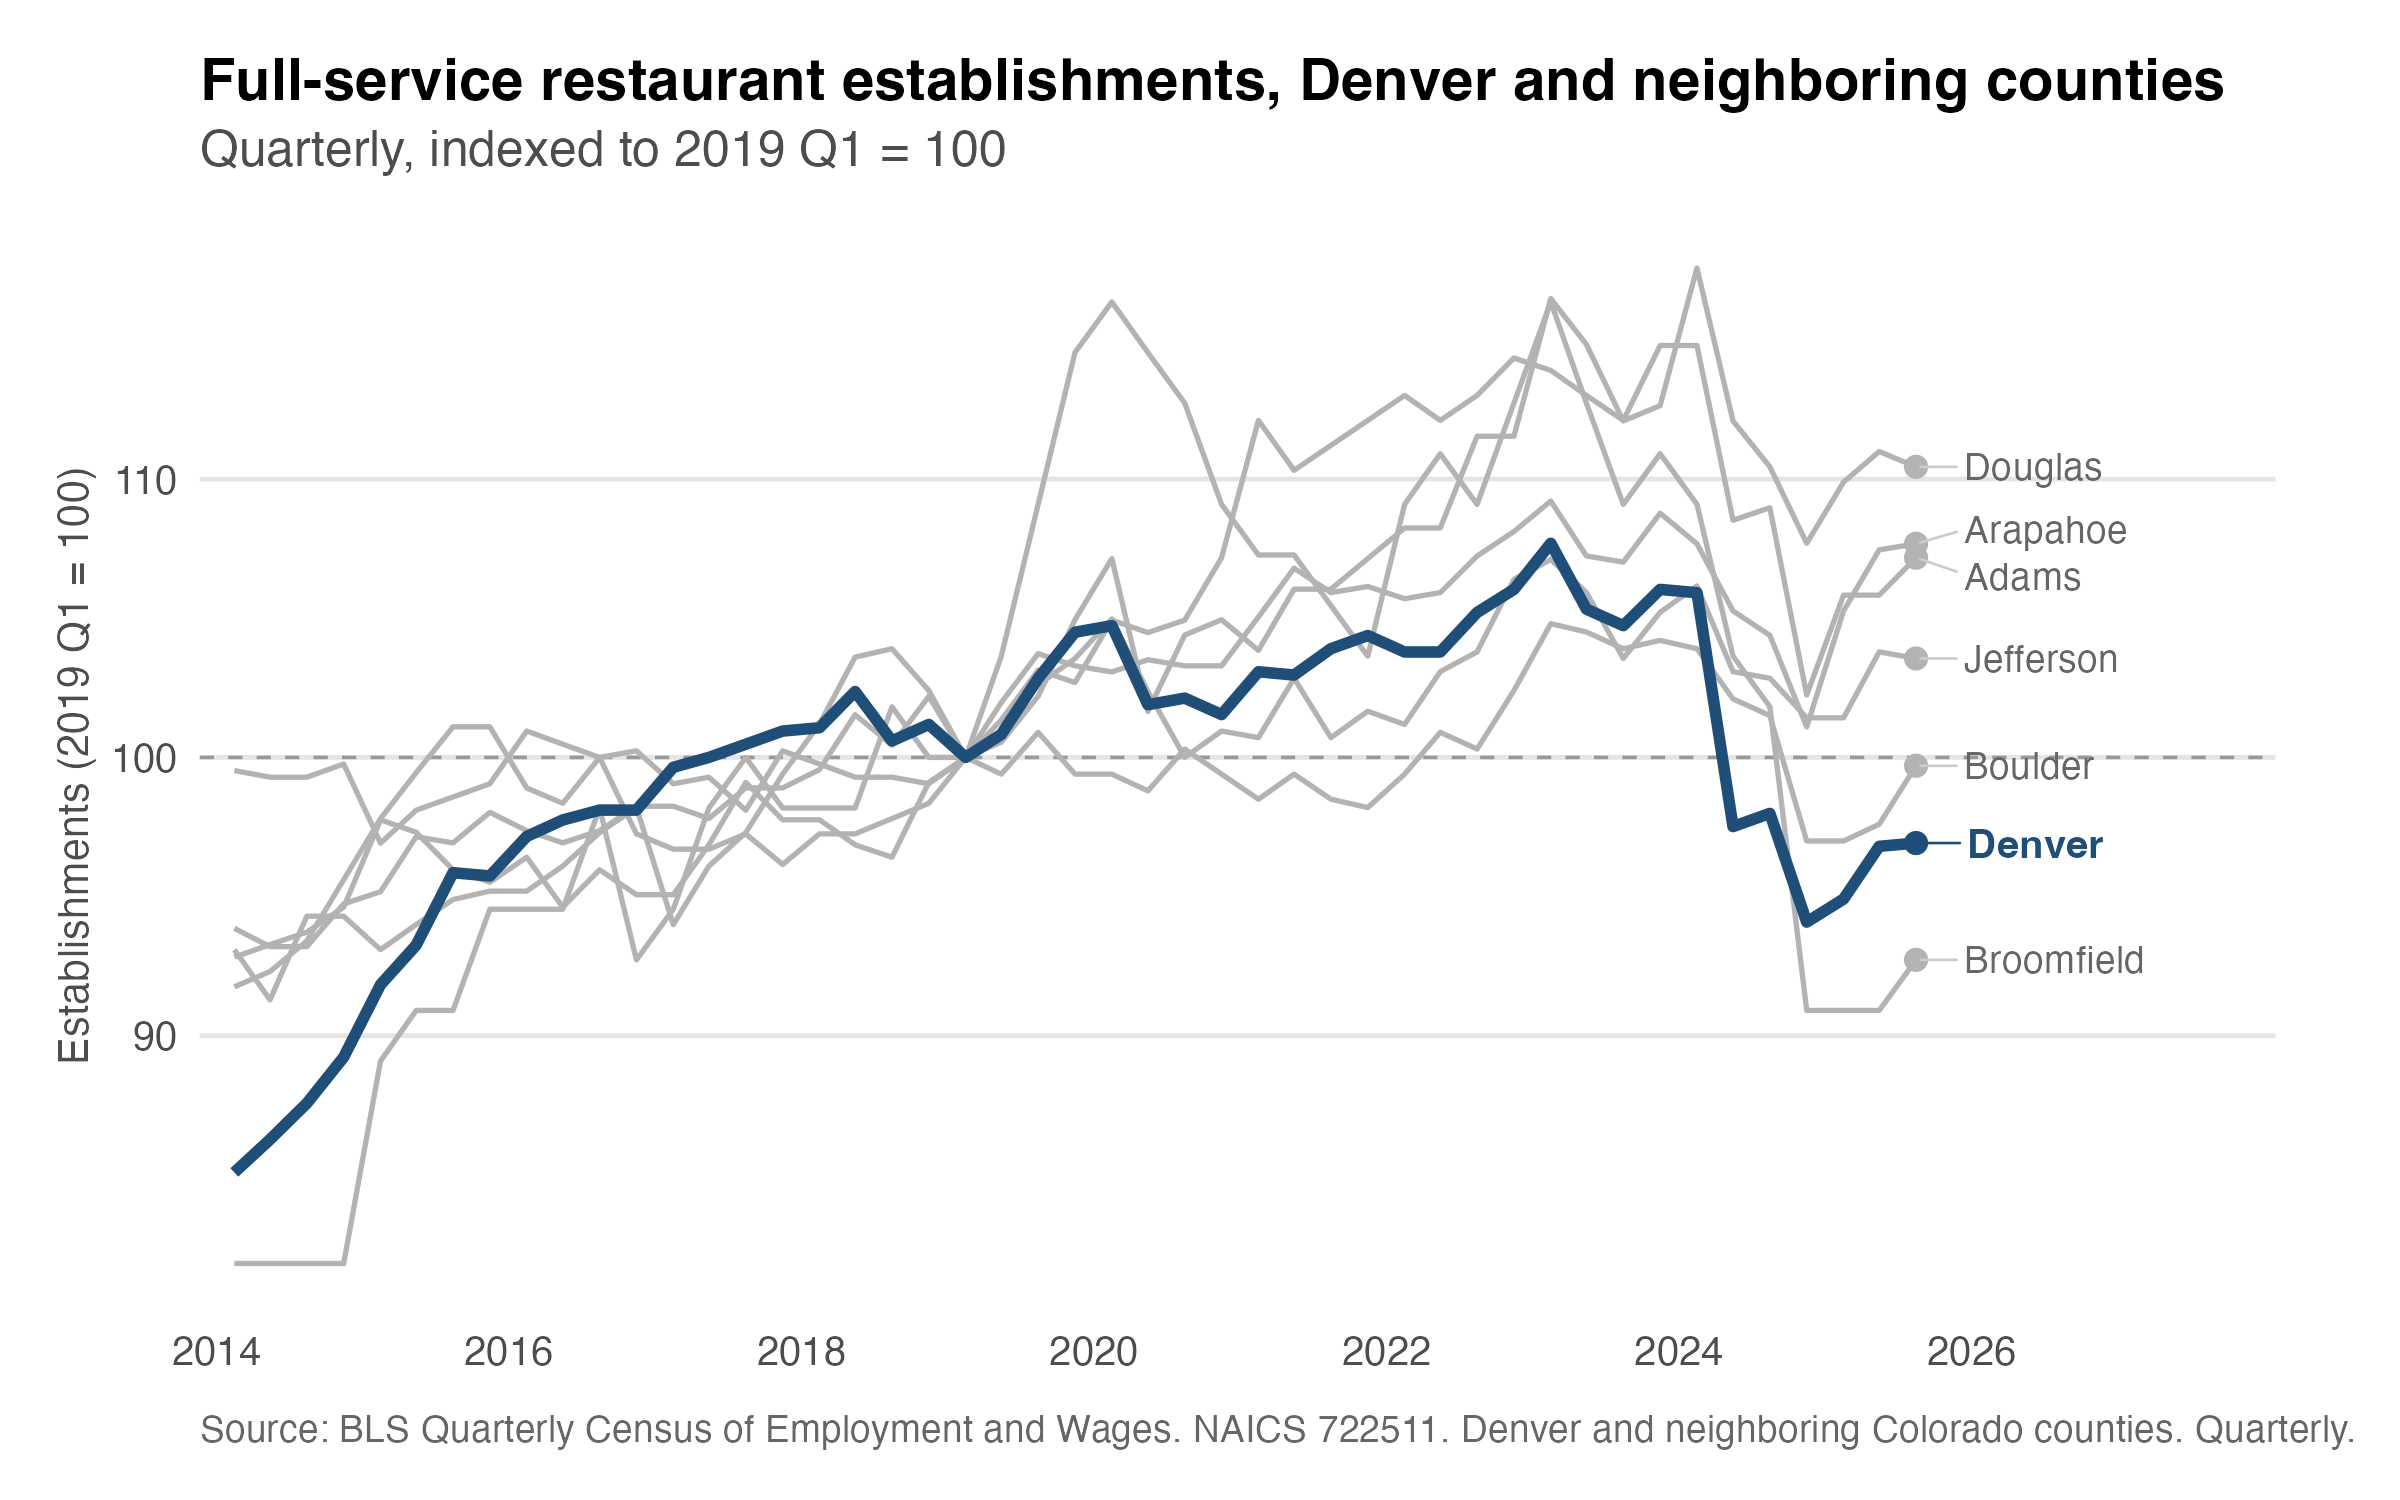
The establishments data pairs well with employment data in helping determine whether restaurants are figuring out how to stay open with fewer employees or whether there is a decline in both employment and the number of restaurants on net. As done with employment, I will start with a chart showing full-service restaurant establishments in Denver and surrounding counties. Right away the story looks a little different. In Denver, despite initial declines early on in the pandemic, the number of full-service establishments didn’t fall below the 2019 level until 2024. Take out and delivery were still options during the height of the pandemic which meant restaurants could stay open even if with much leaner staff. This suggests that despite employment never recovering, Denver was able to add new restaurants for a few years until the decline we see in 2024.
The steep decline continues through 2025 where the latest data show that the number of full-service establishments sits below the 2019 number. Boulder county also saw a decline in establishments and sits just below the 2019 number of restaurants (a decline of 1 establishment). And Broomfield once again appears to be doing poorly, with the number of restaurants 7% below the 2019 figure. Douglas, Arapahoe, Adams, and Jefferson counties have all seen gains in the number of full-service restaurants since 2019. Those counties appear to have figured out how to deal with declines in restaurant employment while still opening new restaurants, the same can’t be said for Denver and Broomfield. Employment and establishments are down in Denver county. It is safe to say there is a slump for full-service restaurants in Denver. The Broomfield case is interesting and may be worth looking more into, but my focus is going to stay on Denver county.
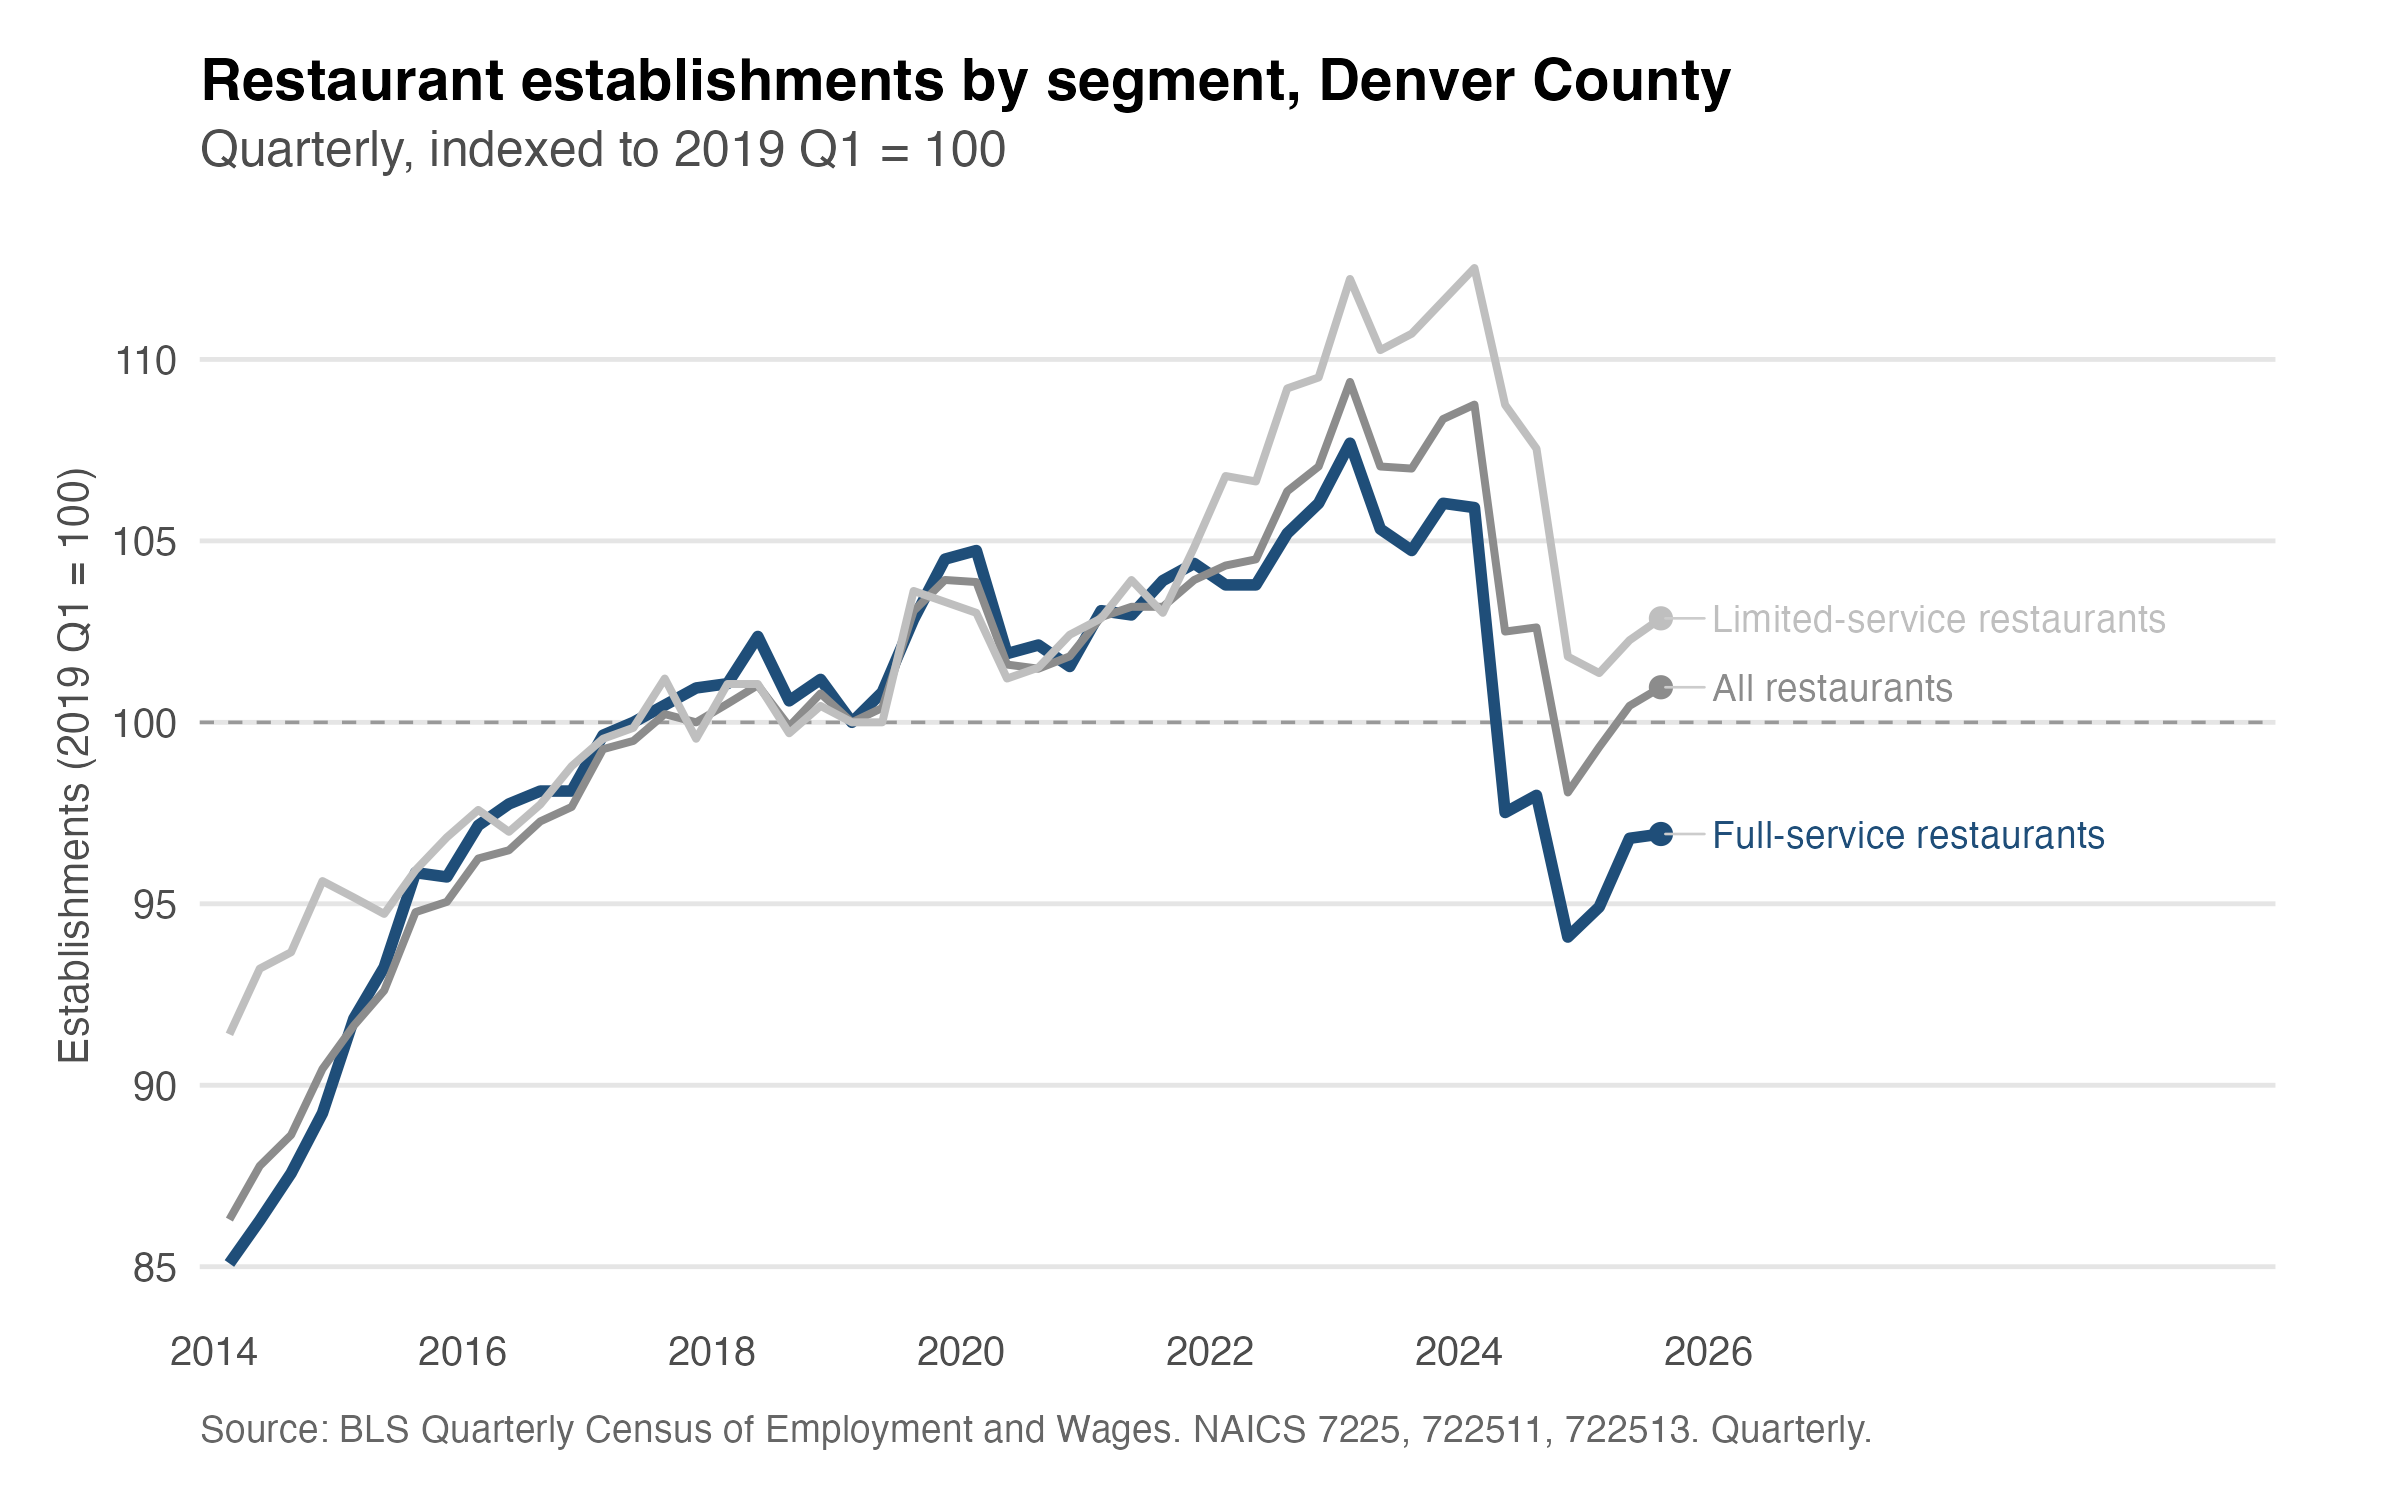
It will be instructive to look at any potential differences in changes in the number of establishments across restaurant types. We observed differential changes in employment across full-service and limited-service restaurants and may see the same thing here. The next chart shows this data for Denver county alone. Again, using 2019 as our 100 value, we can see changes in types of restaurant establishments relative to the first quarter of 2019, pre-pandemic. The change in the number of establishments shows a slight decline during the pandemic across both restaurant types but never below the 2019 baseline. Then, there is an increase in establishments and that is where we begin to see a divergence between full-service and limited-service establishments. At their peak, the number of limited-service restaurants was around 13% higher than in 2019 while full-service restaurants peaked at only around 8% above their 2019 total.
Starting around the same time as the sharp drop in full-service restaurant employment, the number of full-service restaurants begins to decline and this continues through 2025 where the number of restaurants sits around 3% below the 2019 level. The number of limited-service restaurants also declines toward its 2019 level over these quarters but never falls below 100, the most recent data point shows the number of limited-service restaurants is around 3% above the first quarter of 2019. Splitting the restaurant industry into the two sectors shows again that there is not a uniform problem for Denver restaurants. Full-service restaurants are struggling. Employment is dropping and more restaurants are closing than are opening. Limited-service restaurants, on the other hand, are doing better. Employment and establishments are both still above pre-pandemic levels.
At this point it seems clear that Denver’s restaurant industry is facing challenges distinct from those in surrounding counties. The exception is Broomfield which is doing about the same as Denver in terms of full-service employment and even worse in terms of the number of full-service restaurants. But we can also move outside Colorado to make comparisons with similar urban counties around the country to see whether these issues are shared with others outside Colorado.
Restaurant Employment and Numbers in Denver and “Peer” Counties
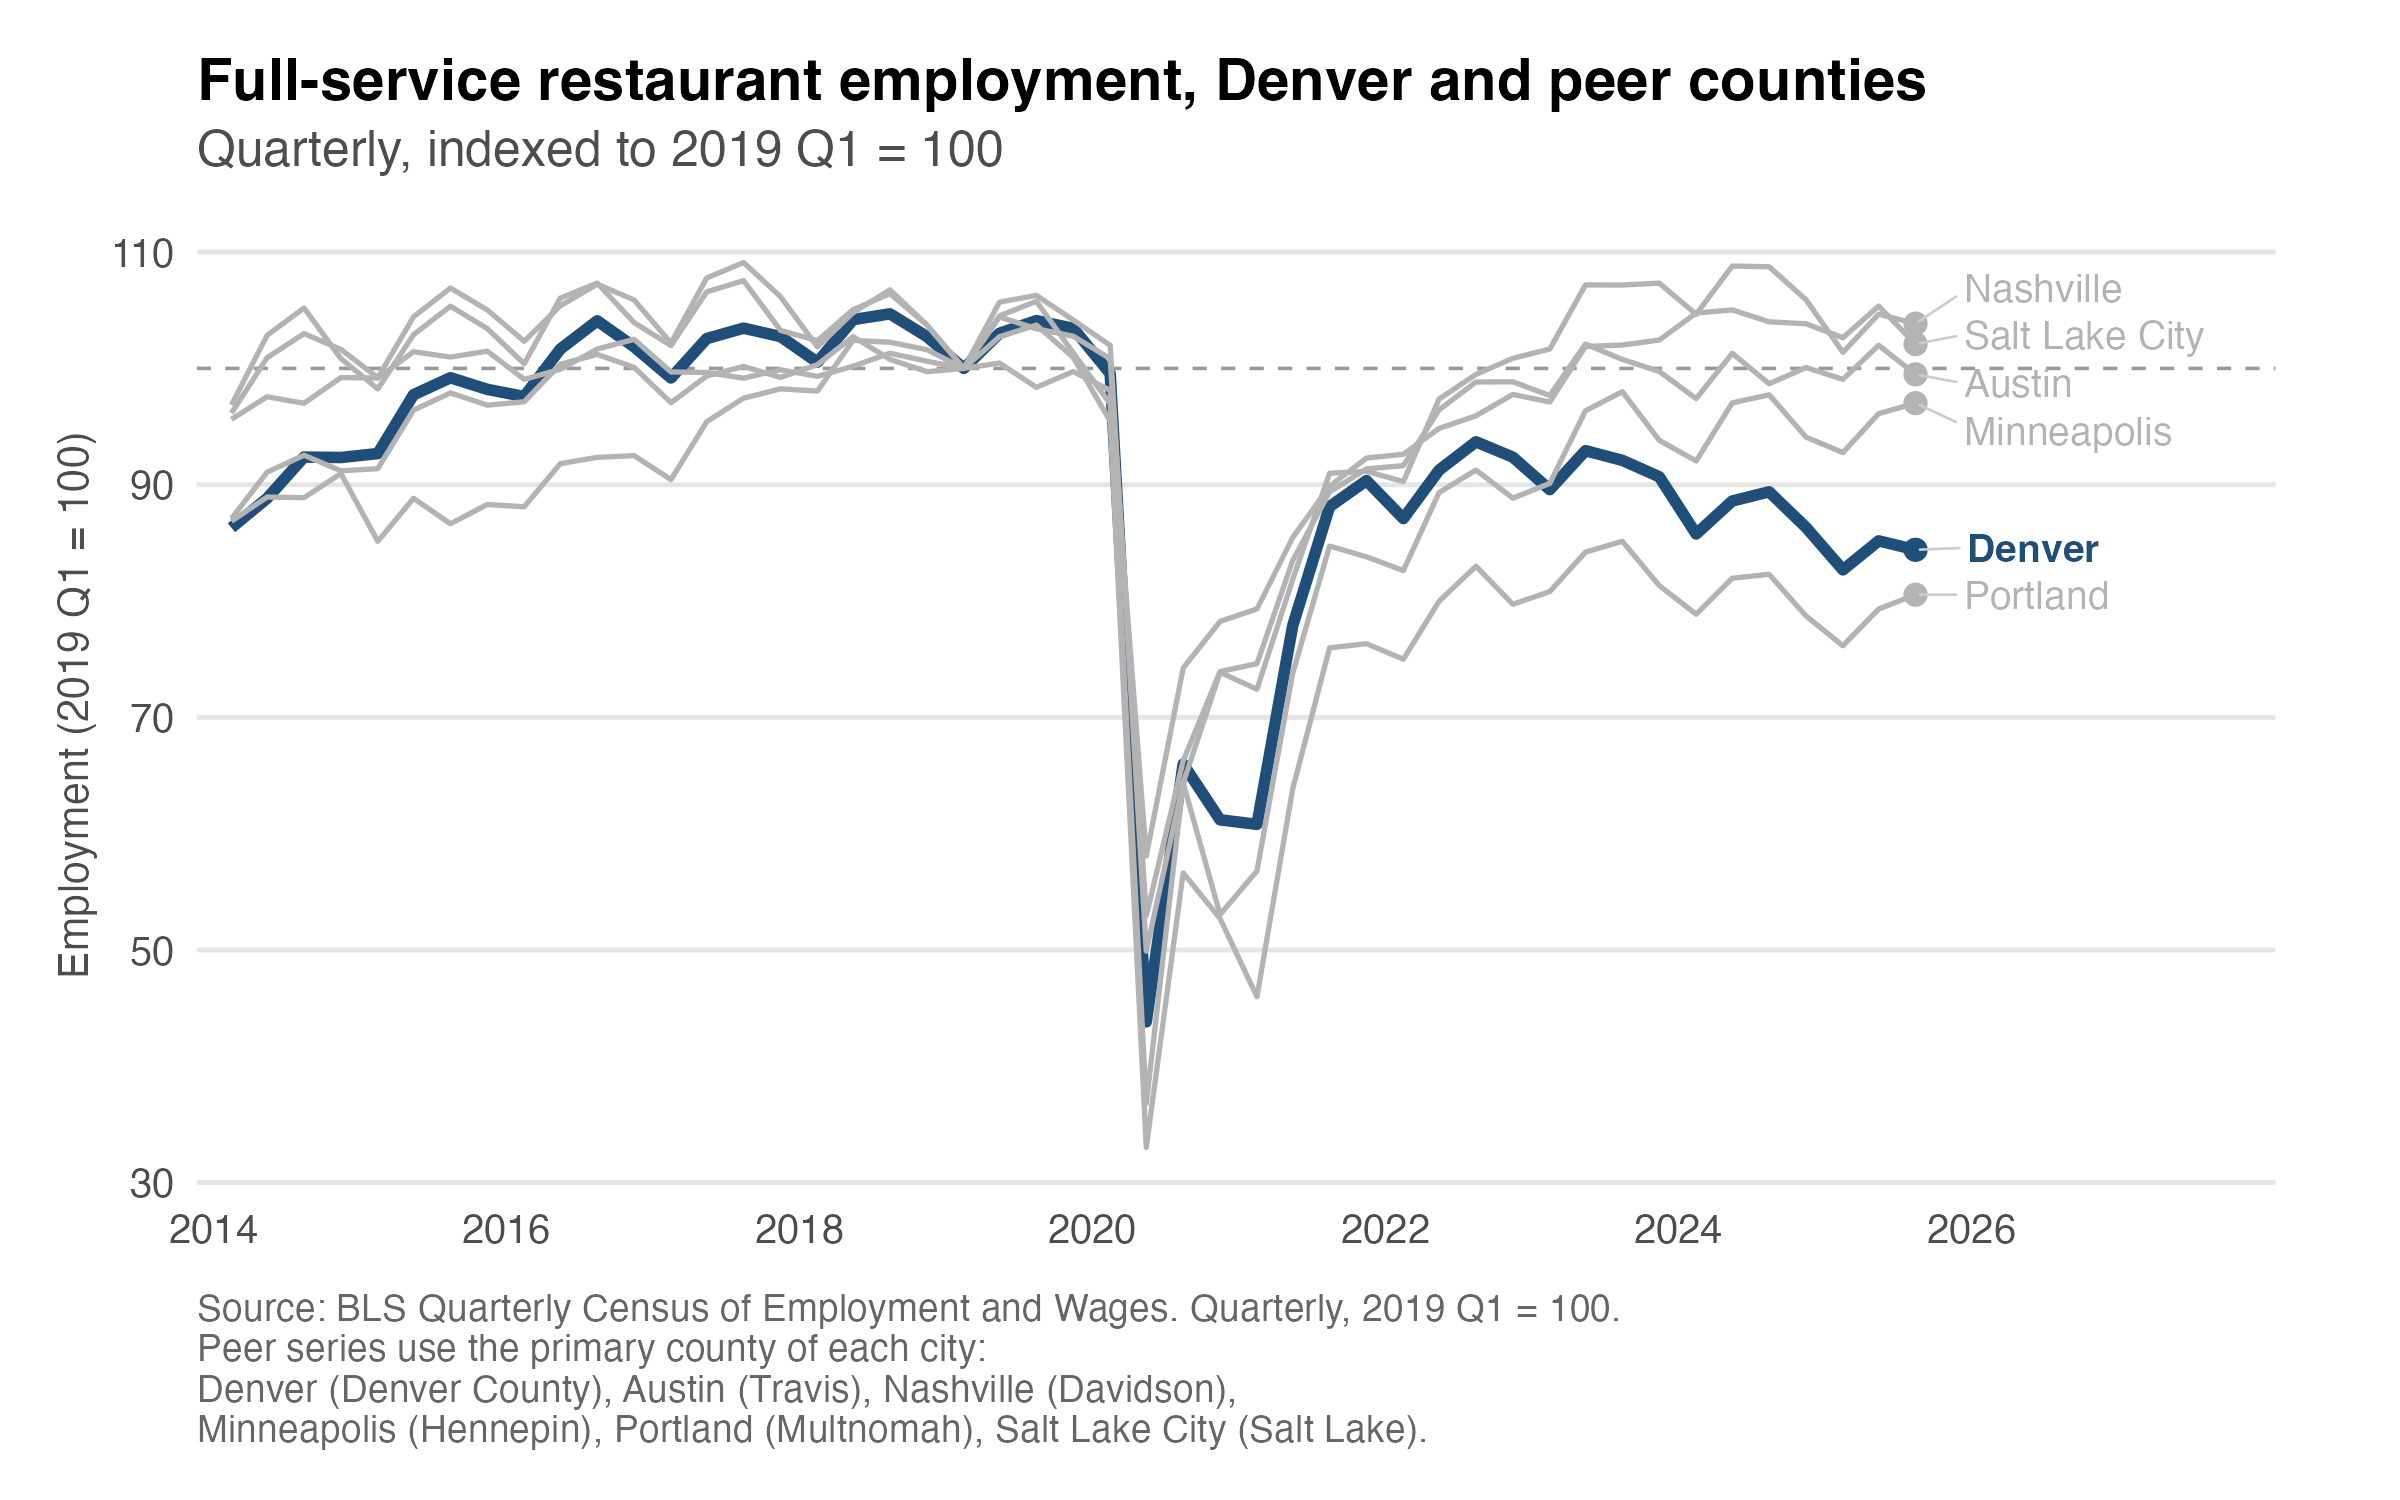
For another set of comparisons, I chose five additional “peer counties” to compare against Denver on restaurant employment and establishments. These counties (largest cities in parentheses) include Davidson (Nashville, TN), Travis (Austin, TX), Hennepin (Minneapolis, MN), Multnomah (Portland, OR), and Salt Lake (Salt Lake City, UT). Denver is somewhat unusual in this comparison because it’s a consolidated city-county while most others are not, Davidson being the exception. So, these are not perfect comparisons, some counties are much larger than Denver and capture more of the surrounding suburbs but do share some characteristics such as an urban downtown core. The counties also vary in their regulatory and minimum wage environment, some more progressive in policy with higher local minimum wage, others not as much. I am not trying to replicate Denver but choose counties that are more plausible comparisons than say comparing Denver to Los Angeles or New York. These are also counties that are home to cities used in the minimum wage comparison in the State of Denver’s Restaurants report across multiple tiers, some with federal minimum wages and others with higher minimum wages. For this section, I will keep it to two charts.
The first chart brings us back to full-service restaurant employment but now comparing Denver county to the peer counties. We already know what has happened in Denver. What is interesting here is that Denver remains among the two worst performers when it comes to employment. The only county to remain well below its 2019 baseline is Portland which is even further below its 2019 baseline. All other comparison counties are within a few percent of their 2019 baseline, suggesting something closer to stability than marked gains or declines. Not great performance, but notably better than Denver and Portland. Denver and Portland are the two poor performance standouts in this set of peer counties. They also share some features of their policy environment, including higher minimum wages, which is one possible explanation among others. Minneapolis also has a high minimum wage but is doing much better than Denver and Portland, minimum wage is only part of the story. I will address this more in Part 2.
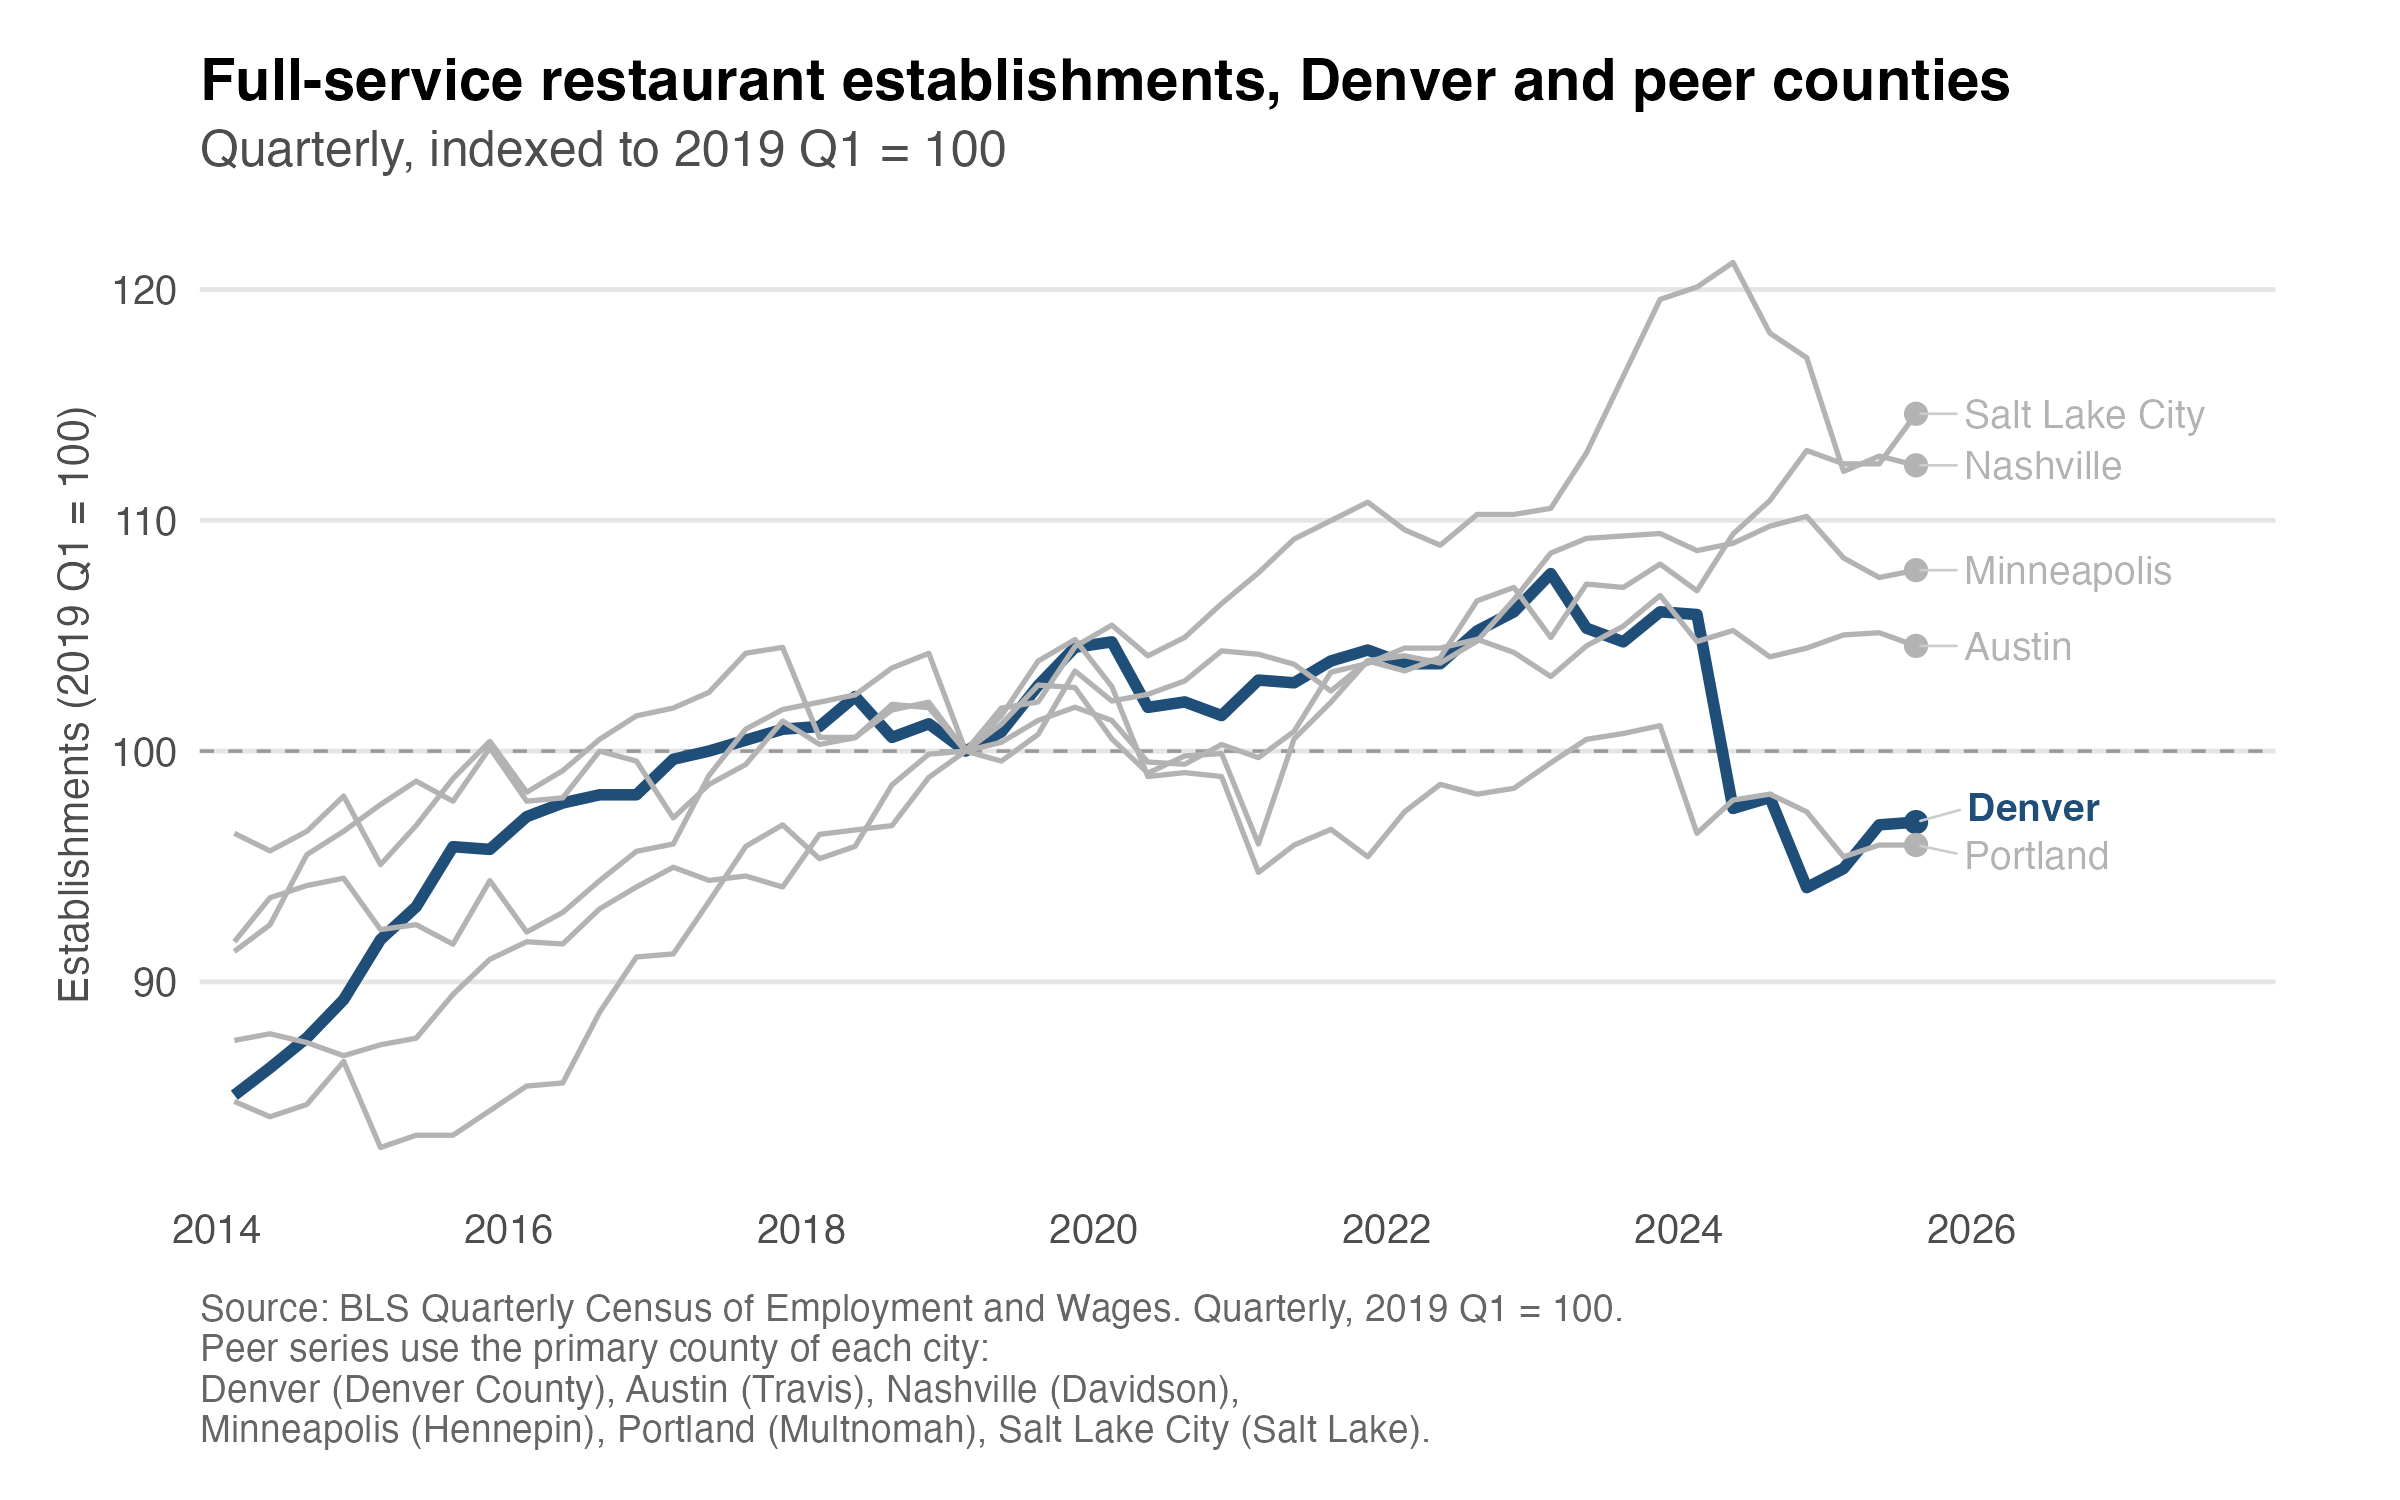
What about establishments? Basically the same story. Denver is only doing ever so slightly better than Portland but this time all other counties are above their 2019 baseline. So, Denver is not unique in facing challenges across full-service restaurants. Portland is doing worse. But many other counties are not seeing this problem. Some people point to national declines in people eating out or shifting to take-out and delivery, yet we don’t see declines in full-servicce establishments across the board in this comparison set. So there is more to the story than national trends.
Conclusion
So, what is going on with Denver’s restaurants? Two things really. Full-service restaurants are in a genuine slump. Fewer people are being employed and more restaurants are closing. This is a good indication that many restaurant operators cannot hire as many workers as they used to and many are choosing to exit the market. But limited-service restaurants are faring better, they continue to open new restaurants and hire more people. And this looks somewhat distinct to Denver. Many of the surrounding counties are not seeing the same declines in employment or establishments. Even when looking outside Colorado, Denver county is doing worse than other plausible comparisons except Portland which is doing even worse. The remaining questions are why is this happening and what can be done about it on the policy side. This post will be followed up with another looking more at the costs and policy sides of Denver’s restaurant woes.
Part 2 of this post can be read here.
The results for Broomfield are somewhat misleading because the base is so small. The percentage changes are correct but raw magnitudes, especially when compared to Denver are much different. “As bad as Denver” is only as true as performance relative to Broomfield’s own base.